On this page
Criminal incident data was sourced from the Crime Statistics Agency.
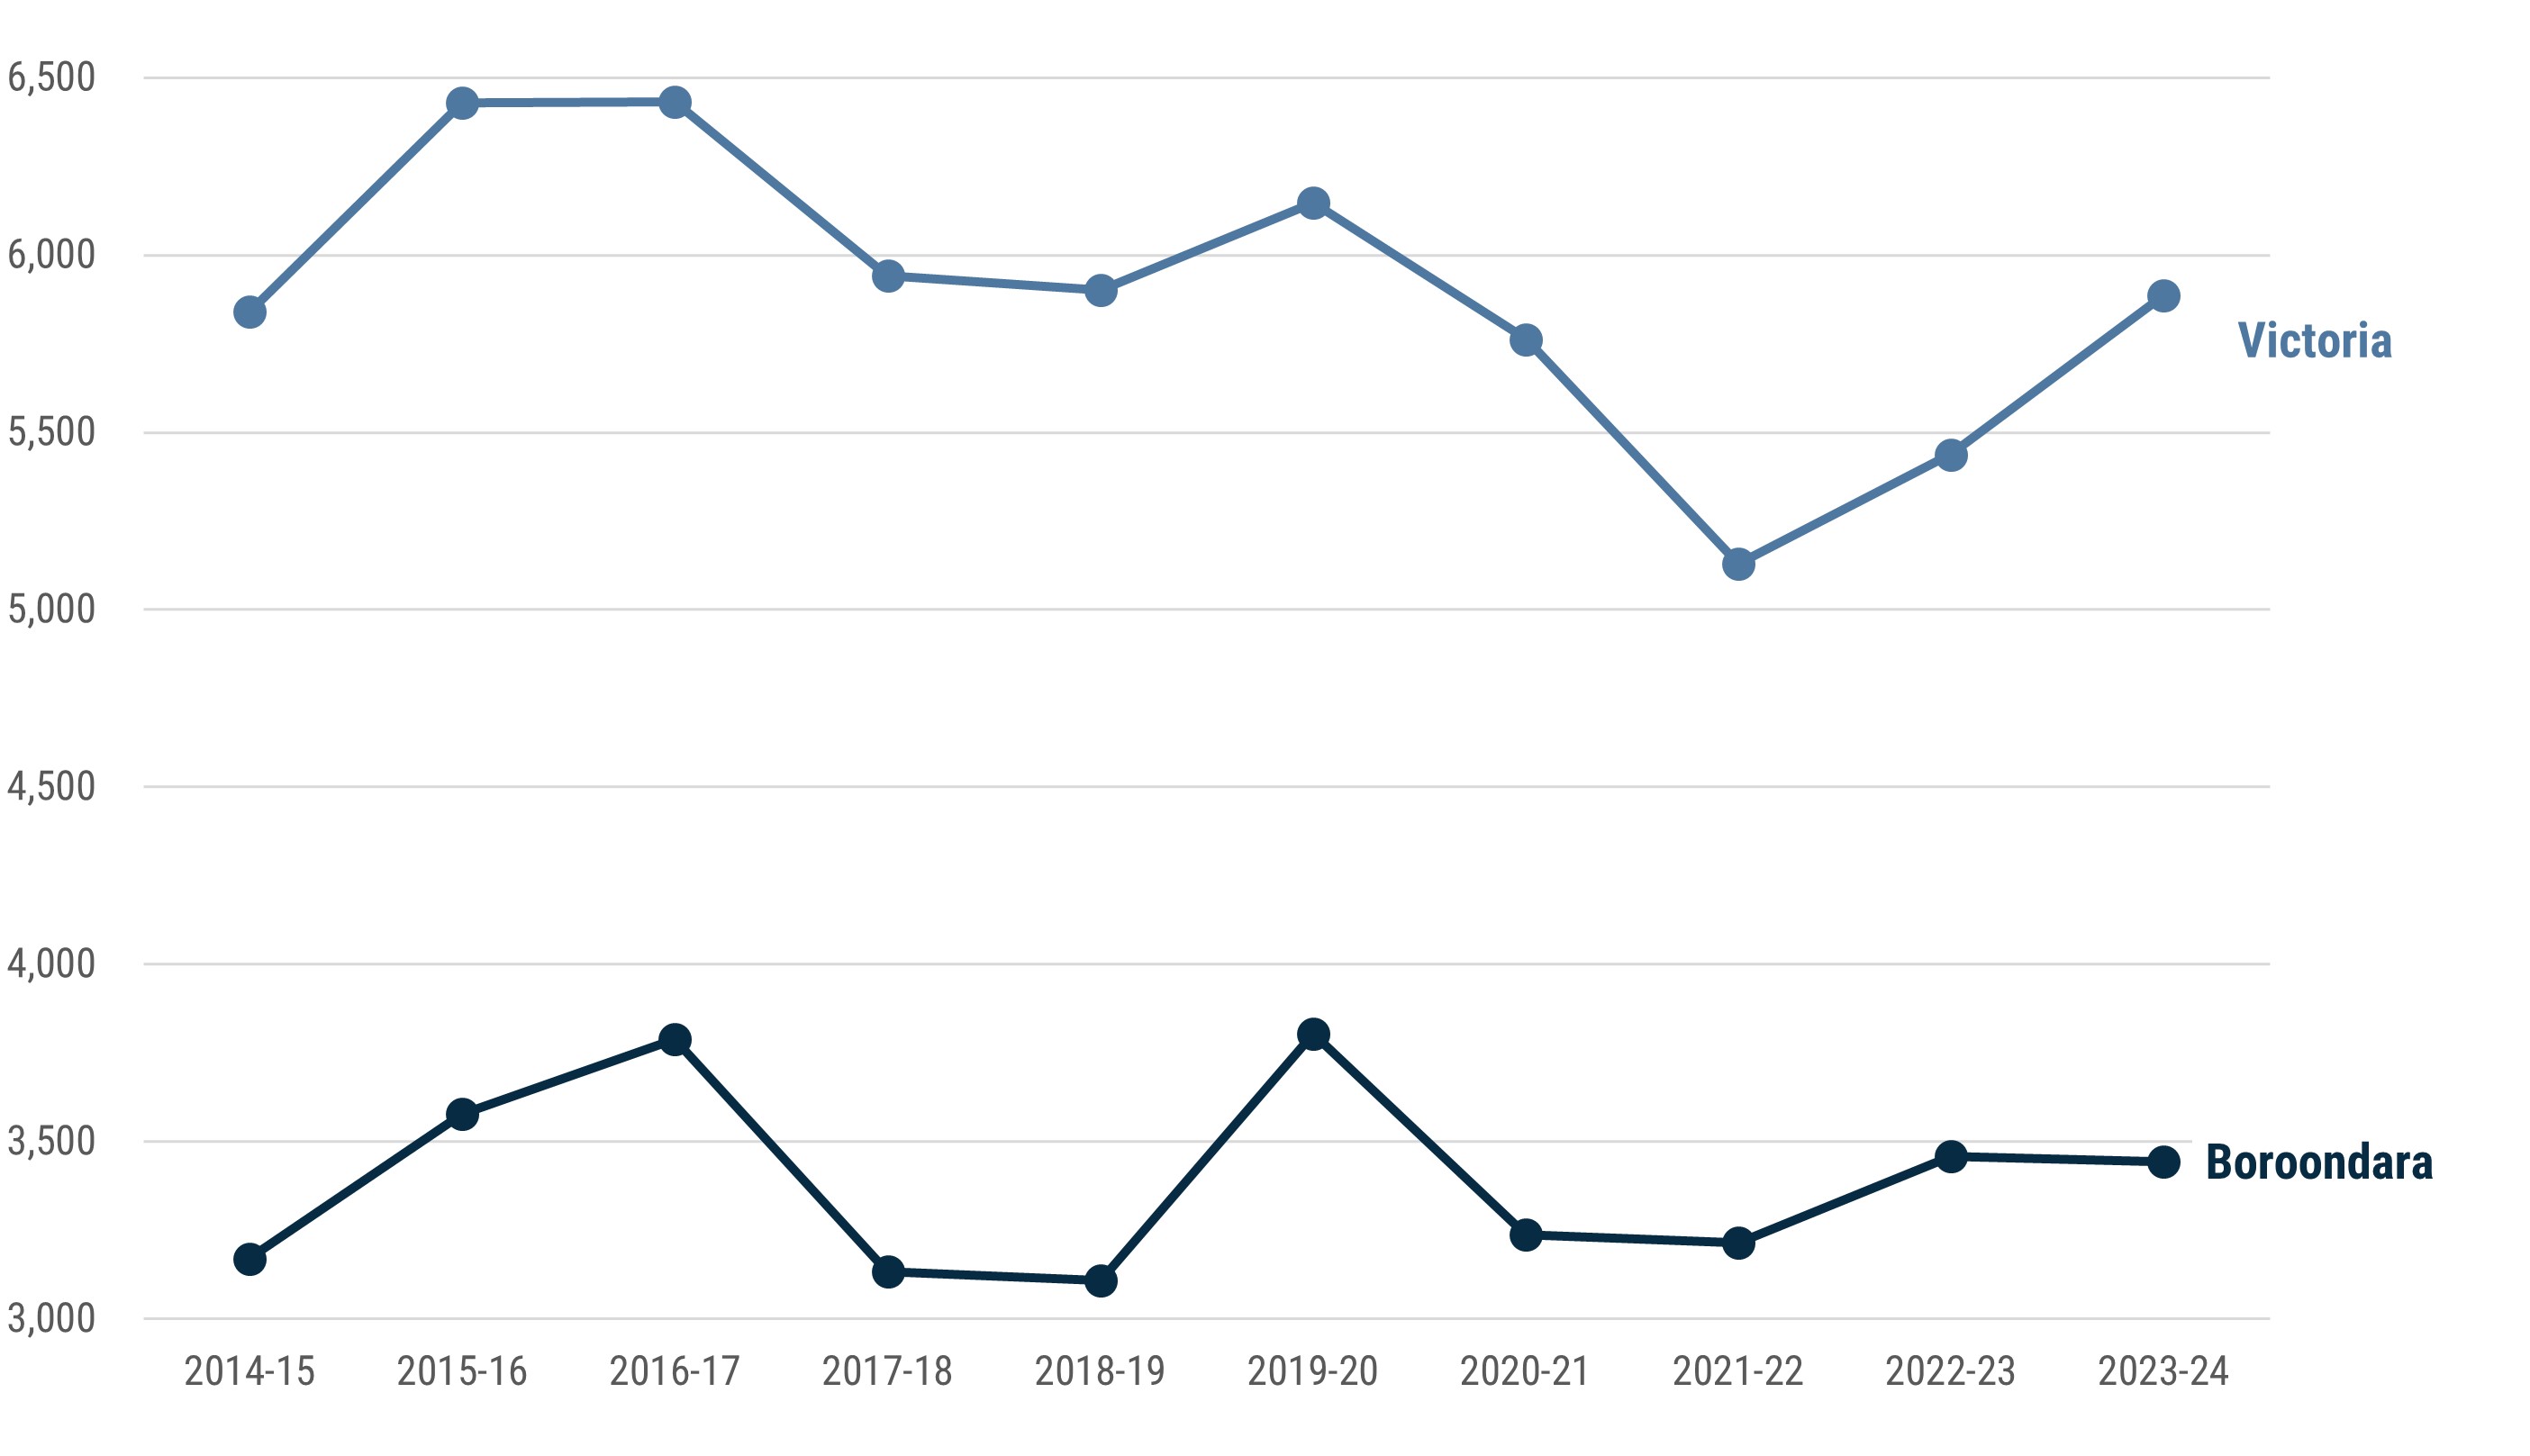
In 2023-24 Victoria Police recorded 6,133 criminal incidents that took place in Boroondara. This was the fourth lowest criminal incident rate per capita of all metropolitan Melbourne local government areas. Boroondara’s criminal incident rate has been considerably lower than Victoria’s for at least the last 10 years (Figure 1).

Figure 1: Boroondara has fewer criminal incidents per 100,000 population than Victoria and 2022-23 and 2023-24 have seen the gap widen.
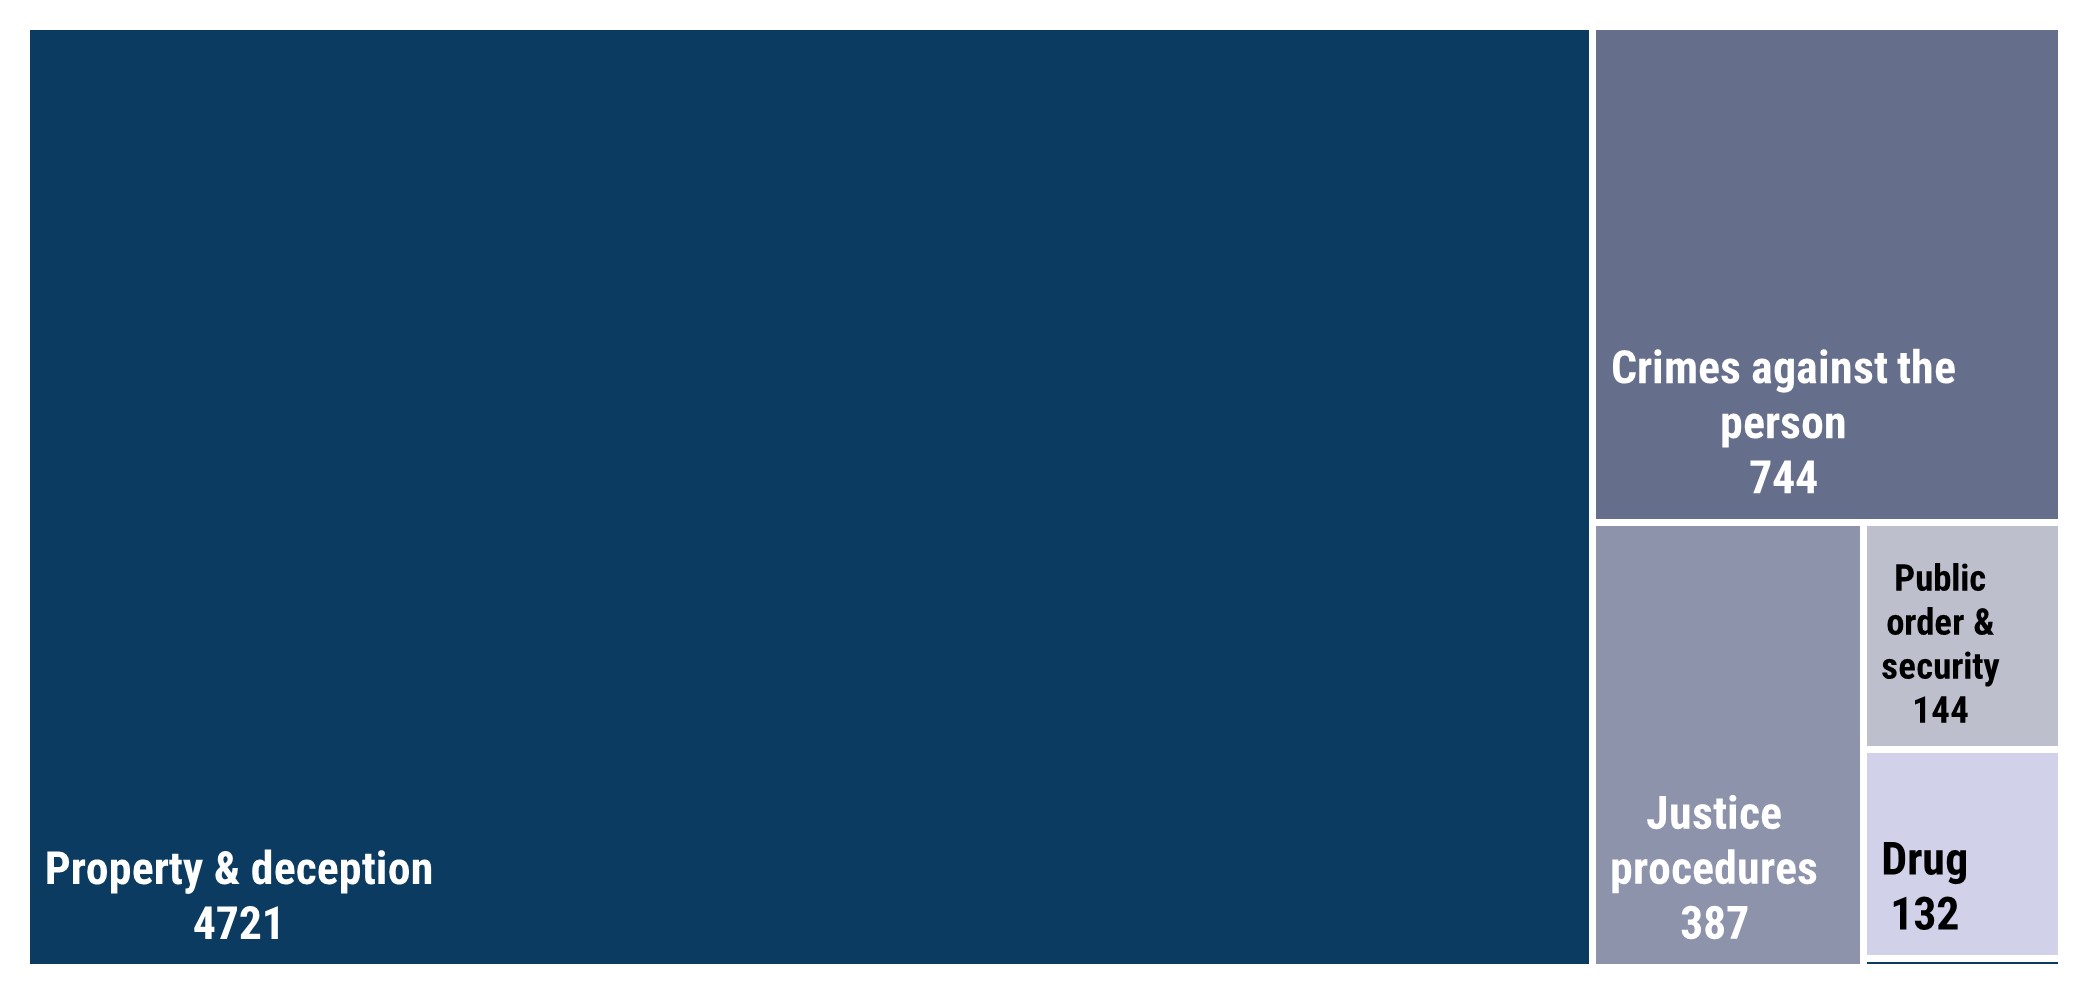
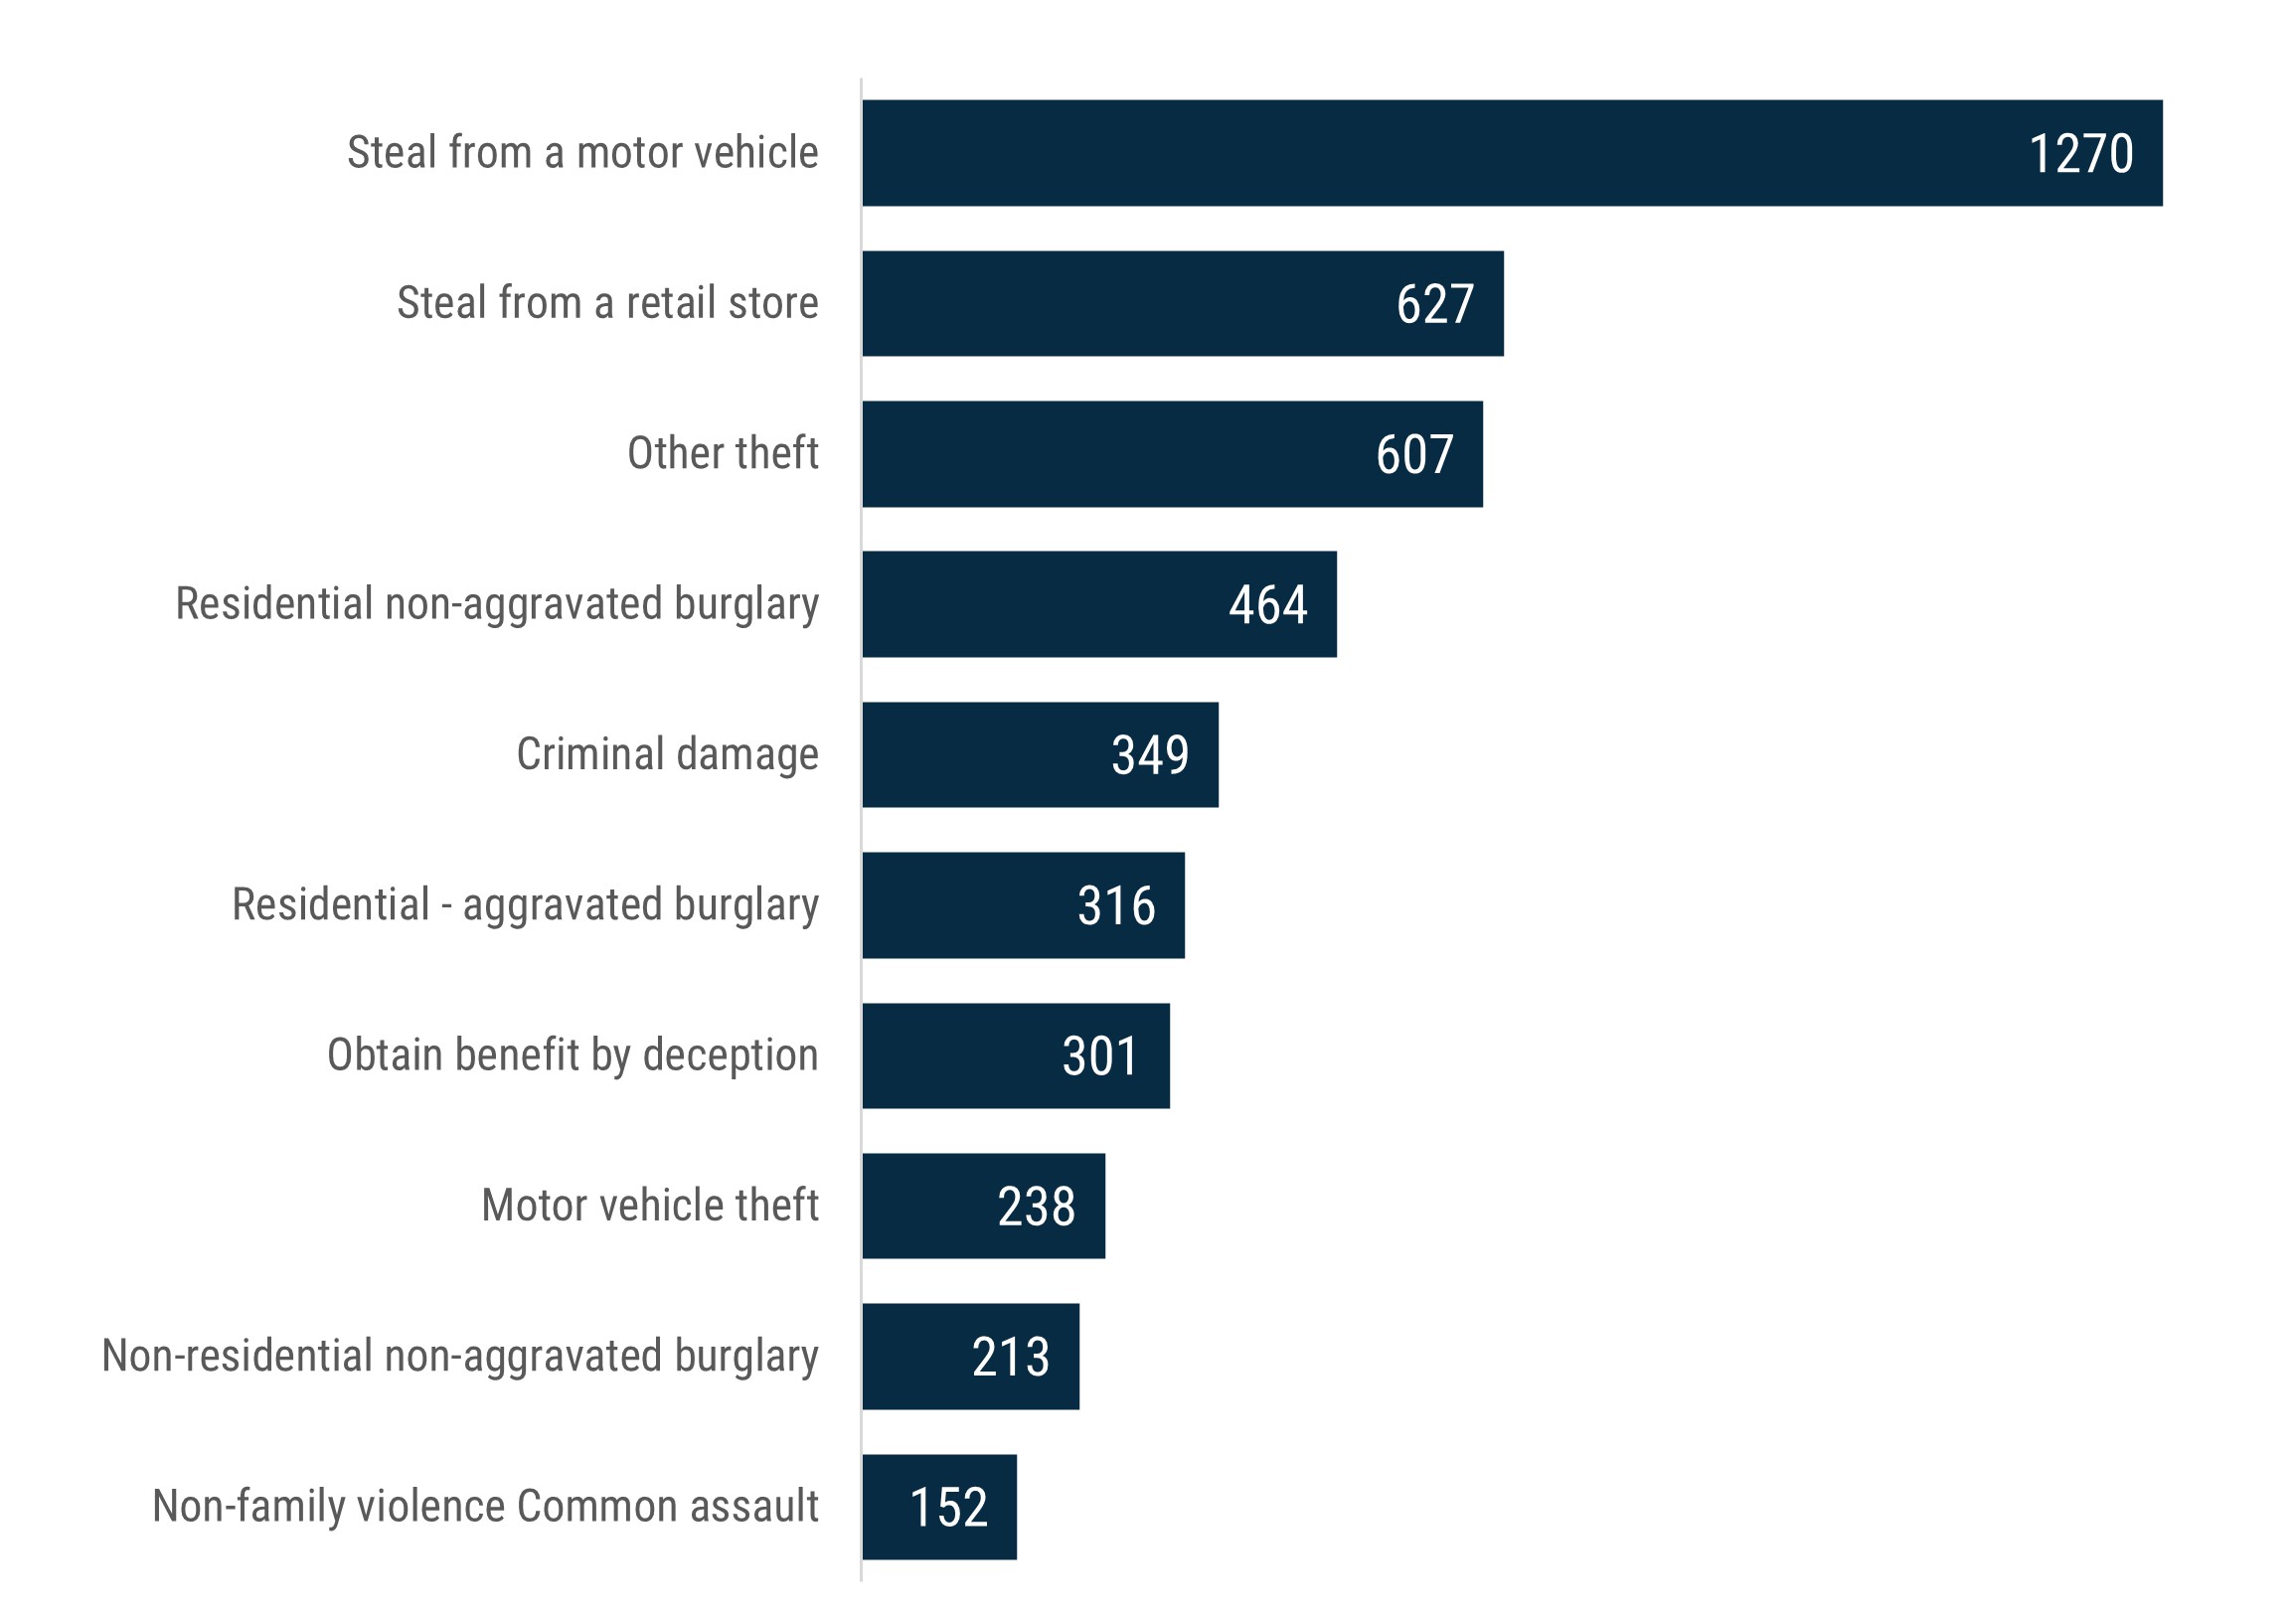
Most recorded criminal incidents in Boroondara are property and deception incidents (Figure 2). The most frequently recorded criminal incident subgroup in Boroondara in 2023-24 was steal from a motor vehicle (Figure 3). This is a property and deception offence.

Figure 2: Most criminal incidents in Boroondara during 2023-24 were property and deception incidents.

Figure 3: The most frequently recorded principal offence subgroup in Boroondara in 2023-24, by a large margin, was steal from a motor vehicle.
Of the 10 most frequently recorded incidents, the principal offence for all but one (Non-family violence common assault) were property and deception offences.
Offence type by region
Table 1 shows Boroondara’s criminal incident rate against the Victorian rate and the average rate for the seven local government areas of the Eastern Metropolitan Region (EMR) which includes:
- Boroondara
- Knox
- Manningham
- Maroondah
- Monash
- Whitehorse
- Yarra Ranges.
Table 1: Criminal incidents per 100,000 residents, 2023-24
| Offence type | Boroondara | EMR LGA average | Victoria |
|---|---|---|---|
| Homicide | 1 | 1 | 3 |
| Assault | 236 | 367 | 628 |
| Sexual offences | 71 | 106 | 149 |
| Abduction | 4 | 4 | 6 |
| Robbery | 29 | 26 | 39 |
| Blackmail and extortion | 2 | 5 | 5 |
| Stalking and threat | 52 | 75 | 119 |
| Dangerous and negligent | 23 | 34 | 60 |
| Total violent offences | 418 | 618 | 1,009 |
Crimes against property
| Offence type | Boroondara | EMR LGA average | Victoria |
|---|---|---|---|
| Arson | 10 | 20 | 37 |
| Property damage | 250 | 320 | 532 |
| Burglary/break and enter | 561 | 496 | 555 |
| Theft | 1636 | 1611 | 2214 |
| Deception | 195 | 213 | 276 |
| Total crimes against property offences | 2,652 | 2,660 | 3,614 |
Drug offences
| Offence type | Boroondara | EMR LGA average | Victoria |
|---|---|---|---|
| Drug dealing and trafficking | 10 | 18 | 34 |
| Cultivate or manufacture drugs | 13 | 22 | 28 |
| Drug use and possession | 51 | 105 | 149 |
| Total drug offences | 74 | 145 | 211 |
Public order and security
| Offence type | Boroondara | EMR LGA average | Victoria |
|---|---|---|---|
| Weapons and explosives | 37 | 72 | 131 |
| Disorderly and offensive conduct | 21 | 24 | 53 |
| Public nuisance | 22 | 20 | 35 |
| Public security | 1 | 0 | Less than 1 |
| Total public order and security offences | 81 | 116 | 219 |
Justice procedures
| Offence type | Boroondara | EMR LGA average | Victoria |
|---|---|---|---|
| Justice procedures | 35 | 60 | 119 |
| Breaches of orders | 182 | 411 | 703 |
| Total justice procedures offences | 217 | 471 | 822 |
Other offences
| Offence type | Boroondara | EMR LGA average | Victoria |
|---|---|---|---|
| Transport regulation offences | 2 | 2 | 3 |
| Other government regulatory offences | 1 | 1 | 2 |
| Miscellaneous offences | 1 | 2 | 3 |
| Total other offences | 4 | 5 | 8 |
For more information on recorded criminal offences, including postcode level crime statistics, see the Crime Statistics Agency.