On this page
Dwelling forecasts
Boroondara is forecast to grow by more than 11,000 dwellings between 2024 and 2044, to approximately 85,600 dwellings. For more information on forecast dwelling growth, see the Boroondara population forecast page on the Forecast i.d. website.
Dwelling density
At the 2021 Census there were 72,812 private dwellings in Boroondara. Dwellings can be categorised as separate or stand-alone houses, medium density or high density:
- Separate/stand-alone houses are free-standing dwellings which are structurally separate from others.
- Medium density dwellings are semi-detached, row, terrace, townhouses and villa units, or flats and apartments in blocks of 1 or 2 storeys, and flats attached to houses.
- High density dwellings are flats and apartments in 3-storey and larger blocks.
The main dwelling type in Boroondara is separate/stand-alone houses (52.7%). However, the profile of housing varies across the municipality, as shown in Map 1.

Map 1: Stand-alone houses are the dominant dwelling type in Boroondara, with medium and high density dwellings common in some Boroondara neighbourhoods. Data source: Atlas i.d.
Between the 2016 and 2021 Censuses, the proportion of Boroondara’s dwellings that were stand-alone houses decreased slightly (see Figure 1 below). A similar decline was evident across Greater Melbourne, where stand-alone houses dropped from 66.1% of dwellings in 2016 to 65.1% in 2021.

Figure 1: The proportion of Boroondara dwellings that are stand-alone houses decreased between 2016 and 2021. Data source: Id Profile
Household type and dwelling density
Different household types have different dwelling preferences. Most of Boroondara’s almost 22,000 couple families with children live in separate/stand-alone houses.
In contrast, most of Boroondara’s lone person households live in medium density or high density dwellings (see Figure 2).

Figure 2: Most couple-only households and households with children live in stand-alone dwellings. Most lone person and group households live in medium or high density dwellings. Data source: Australian Bureau of Statistics general community profile for Boroondara
Non-private dwellings
Non-private dwellings provide a communal form of accommodation. In 2021, there were 106 non-private dwellings housing 3,548 people counted in Boroondara. Accommodation for older or retired people was the most numerous type of non-private dwelling as well as the type that housed more residents.
The table below shows non-private dwellings in Boroondara by dwelling type and number of residents.
| Type of non-private dwelling | Number of residents | Number of these dwellings in Boroondara |
|---|---|---|
| Accommodation for retired or aged people (not self-contained) | 1, 113 | 25 |
| Hotel, motel or bed and breakfast | 182 | 12 |
| Boarding house or private hotel | 147 | 12 |
| Residential college or hall or residence | 486 | 12 |
| Nursing home | 789 | 11 |
| Convent, monastery etc | 97 | 9 |
| Boarding school | 230 | 6 |
| Public hospital (not psychiatric) | 174 | 6 |
| Private hospital (not psychiatric) | 168 | 6 |
| Psychiatric hospital or institution | 132 | 5 |
| Hostel for disabled people | 21 | Not provided |
| Other/non-classified | 9 | Not provided |
Data source: Australian Bureau of Statistics Tablebuilder Pro, 2021 Census
Note: To protect privacy, the Australian Bureau of Statistics does not provide data for cells with very low counts.
Rooming houses
A rooming house is a building or apartment with one or more rooms for rent, where at least four people can live. Rooming houses are different from other share houses as the rooming house operator decides who lives there and usually has individual agreements with each resident (Tenants Victoria 2023). In January 2025, there were 15 registered rooming houses in Boroondara (Consumer Affairs Victoria 2024).
Social housing
Social housing is made up of public housing and community housing. Public housing is managed by Homes Victoria within the Victorian Department of Families, Fairness and Housing. Community housing is managed by not-for-profit housing associations such as Servants Community Housing.
The City of Boroondara has a small amount of social housing. At the 2021 Census, Boroondara was ranked 27 out of 31 Greater Melbourne local government areas for the proportion of households in social housing (with rank 1 having the highest proportion of households in social housing). In June 2024 there were 931 social housing dwellings in Boroondara (see the Word document on Housing assistance from the Department of Families, Fairness and Housing) which represents approximately 1.2% of all Boroondara dwellings.
Due to the limited stock, there are extensive waiting lists for social housing. In Victoria during 2021–22, 50% of newly allocated greatest need households in public housing were allocated a dwelling within 17 months; 75% waited up to 38 months, and 25% of newly allocated greatest need households waited longer than 38 months (Productivity Commission 2023). The Productivity Commission notes that Victoria saw a marked increase in demand for social housing driven in part by COVID-19 emergency response measures aimed at providing accommodation for people sleeping rough. Find out more on the Productivity Commission's most recent report on the performance of governments in providing social housing.
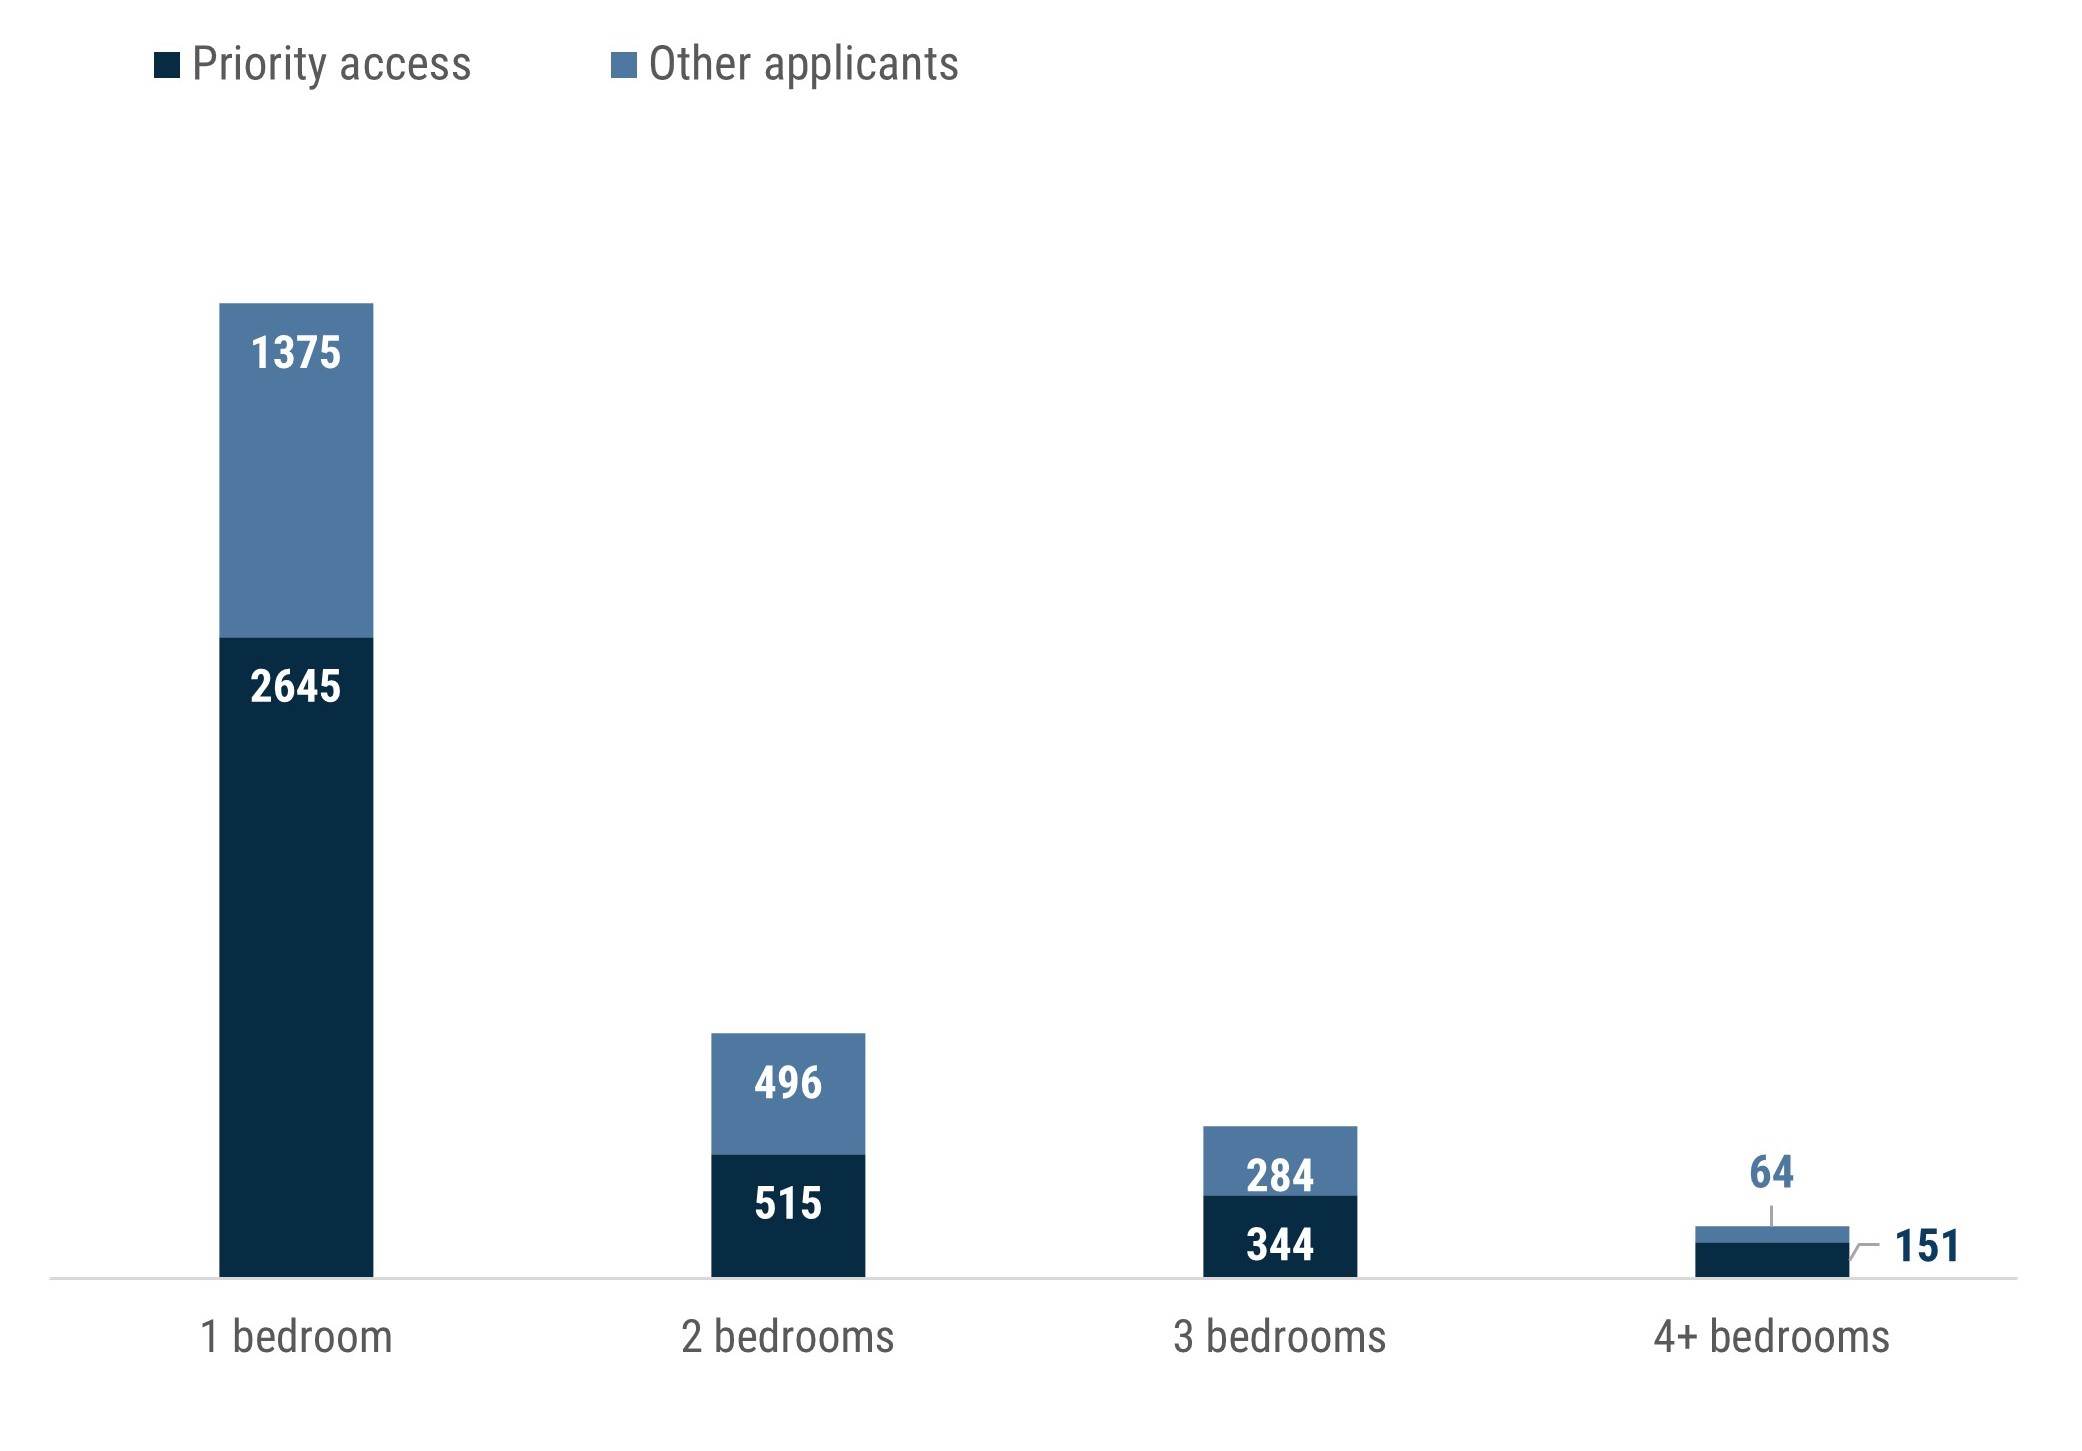
Homes Victoria reports that in September 2024, 5,874 social housing applicants had nominated the Box Hill catchment (Boroondara, Whitehorse and Manningham) as one of their location preferences. Of these, 3,655 were priority access applicants (households most in need of housing) and 2,219 were other applicants (households who do not have an urgent housing need but are seeking to live in social housing). Most applications on the wait list were for 1 bedroom dwellings (Figure 3). Find out more on the Homes Victoria page for Applications on the Victorian Housing Register.
It is important to note that each social housing applicant selects 2 or 3 location preferences on average, and can select up to 5. This means that some applicants counted in Figure 3 could be allocated social housing in an alternative area of their preference.

Figure 3: The number of applications on the wait list for 1 bedroom social housing dwellings in the Box Hill catchment more than doubles the number of applications for dwellings of 2+ bedrooms. Data source: Homes Victoria, December 2024 data.
Housing affordability: Rent
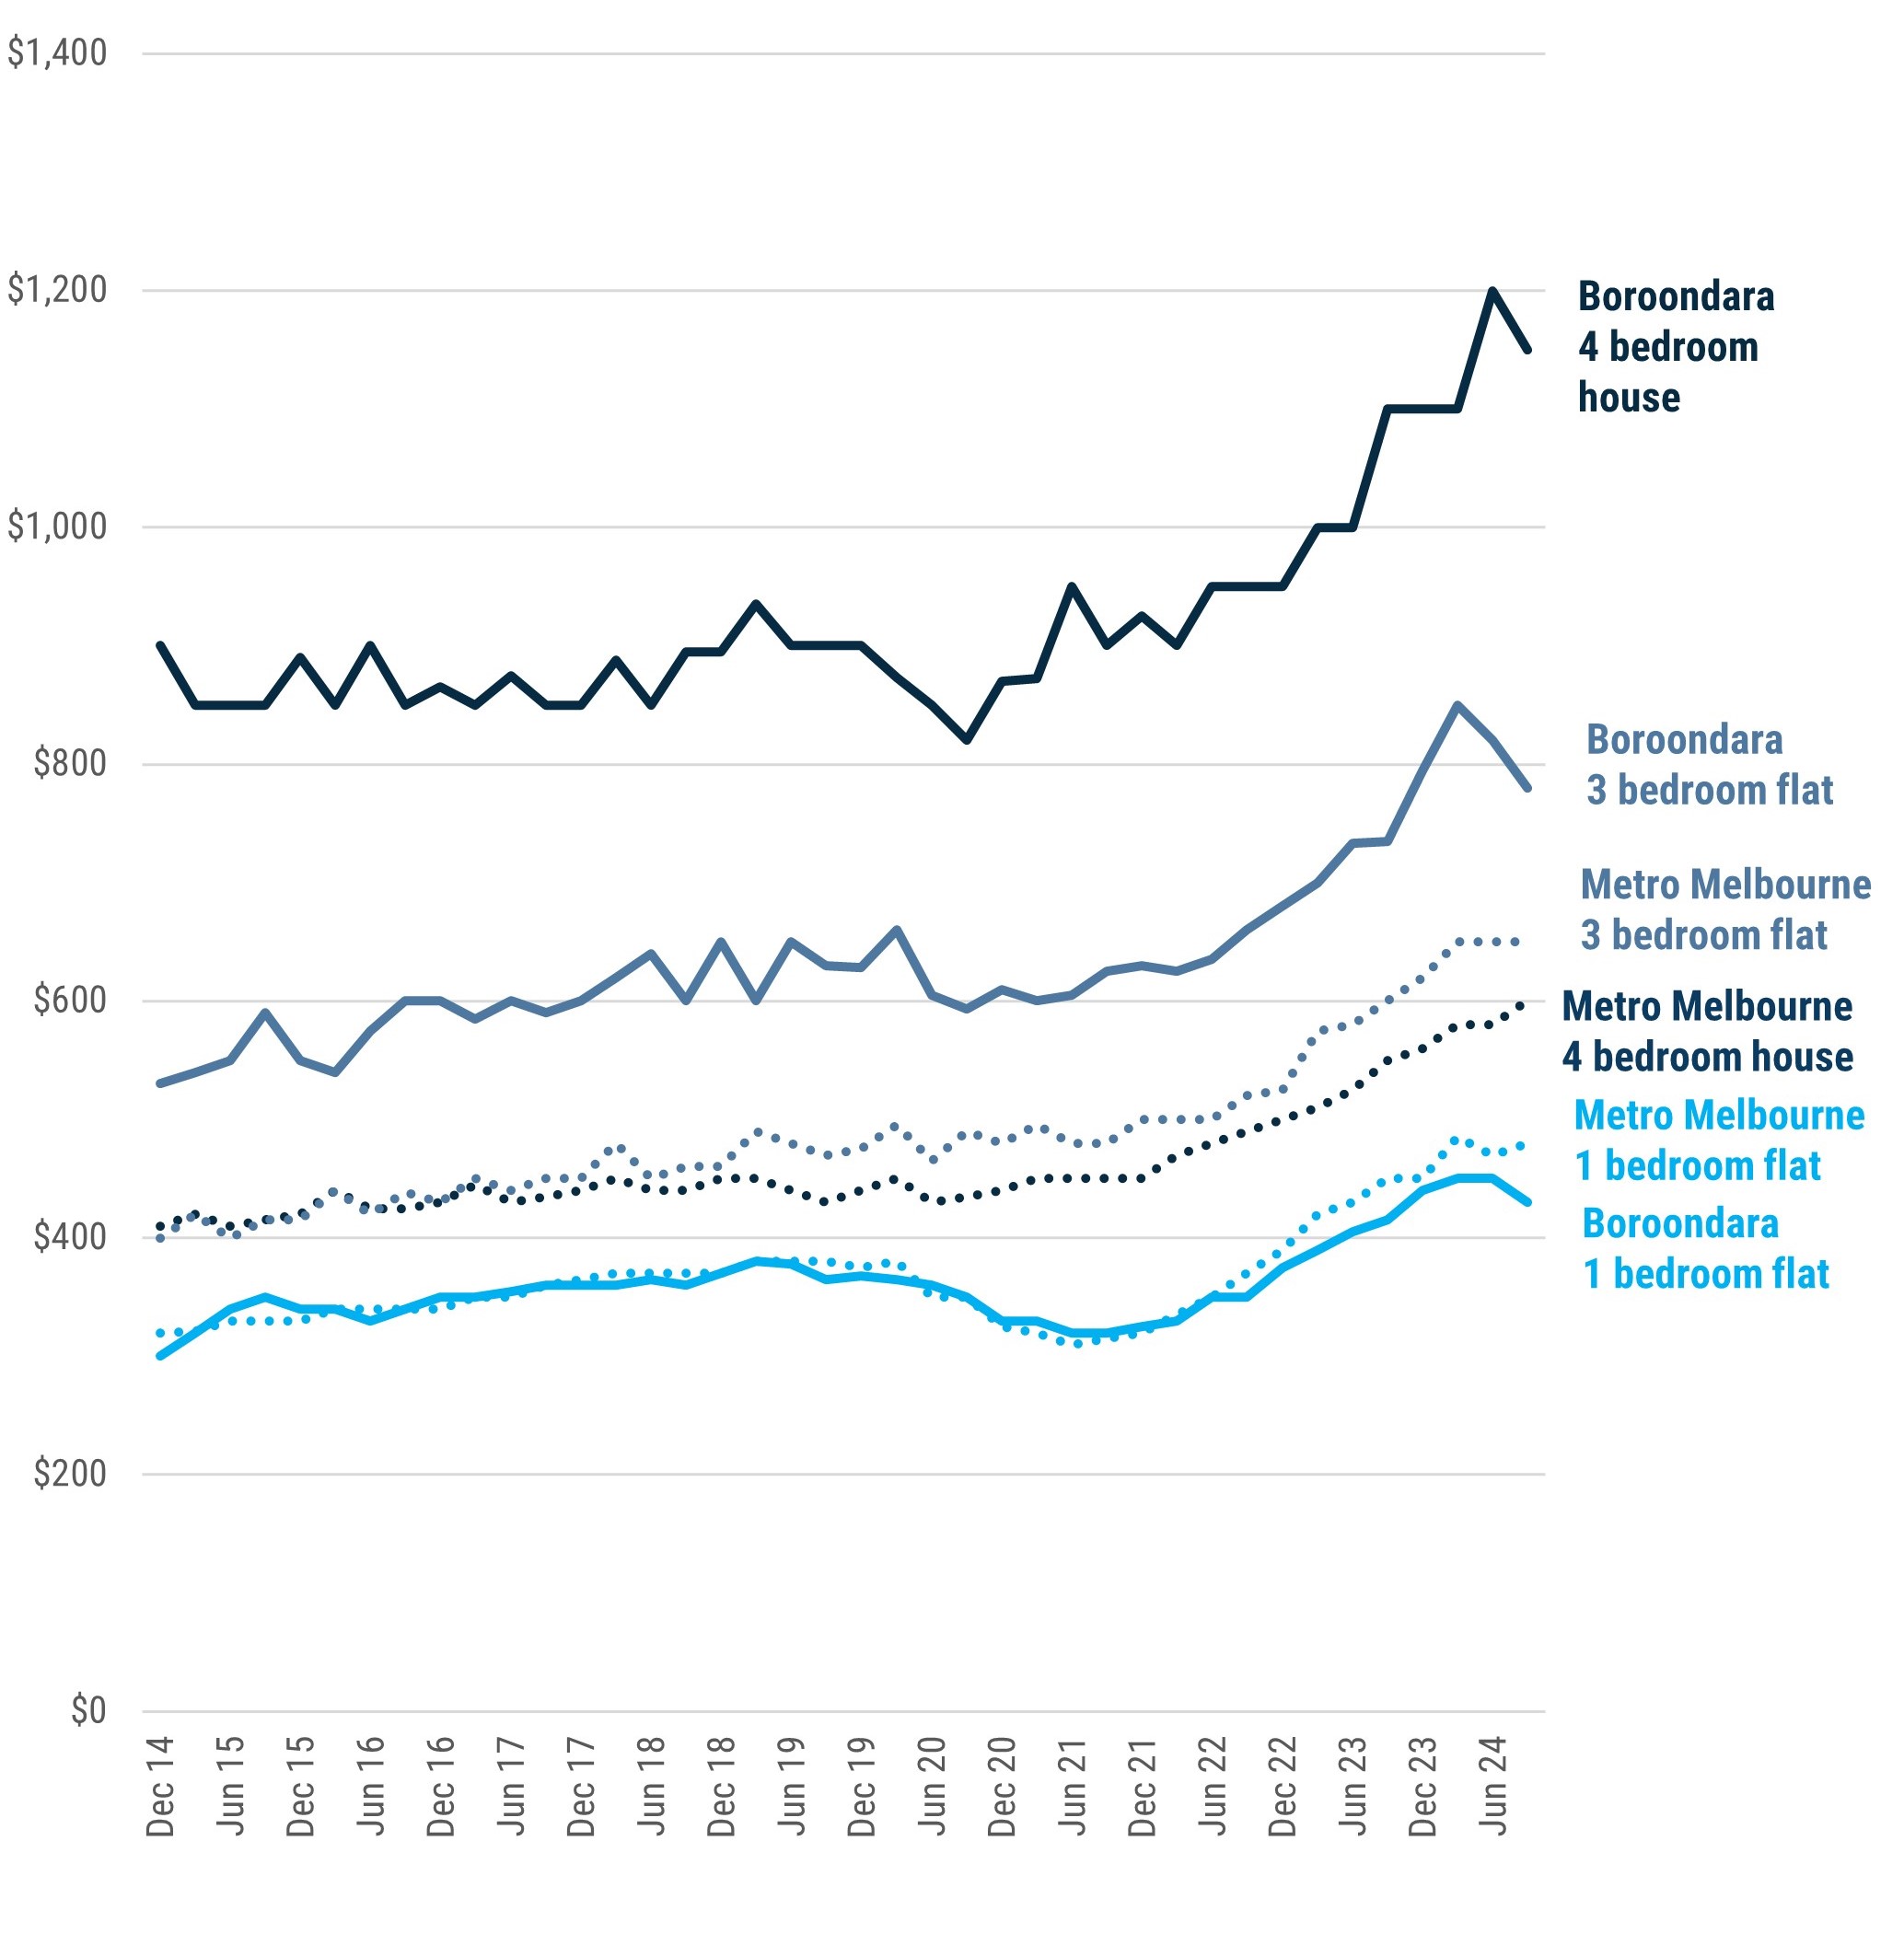
Rental cost differences between metropolitan Melbourne and Boroondara widen as dwellings increase in size. In September 2024, renting a four-bedroom house in Boroondara cost almost double the metropolitan Melbourne median ($1150 per week compared to $600). Rental cost trends for selected dwelling types are shown in Figure 4.
The decrease in median weekly rent evident around 2020 may be attributable to the COVID-19 pandemic. Rent in Boroondara has now exceeded pre-pandemic levels.
The Department of Families, Fairness and Housing reported that in the September quarter of 2024, 40 (2.6%) of dwellings available for rent in Boroondara were affordable for households receiving a Centrelink payment. Forty is the most affordable lettings since the June 2014 quarter. Typically, no affordable lettings are one-bedroom dwellings, meaning no dwellings let for rent in Boroondara are affordable for a single person on Jobseeker. In the September quarter of 2024, 14 of the 40 affordable lettings were one-bedroom dwellings. See details on the page for Department of Families, Fairness and Housing Rental Report statistics for September quarter 2024.

Figure 4: Weekly rent is generally higher in Boroondara than the Metropolitan Melbourne median, and the difference is more pronounced for larger properties. Data source: Homes Victoria, December 2024 data.
House and unit prices
Between 2006 and 2021 the median price of a house in Boroondara increased by 215%. The median income of Boroondara households increased by 57% over the same period (Figure 5).

Figure 5: In Boroondara, growth in median house prices has outpaced growth in median household incomes. Data sources: Property sales statistics from Department of Environment, Land, Water and Planning and Australian Bureau of Statistics census data 2021.
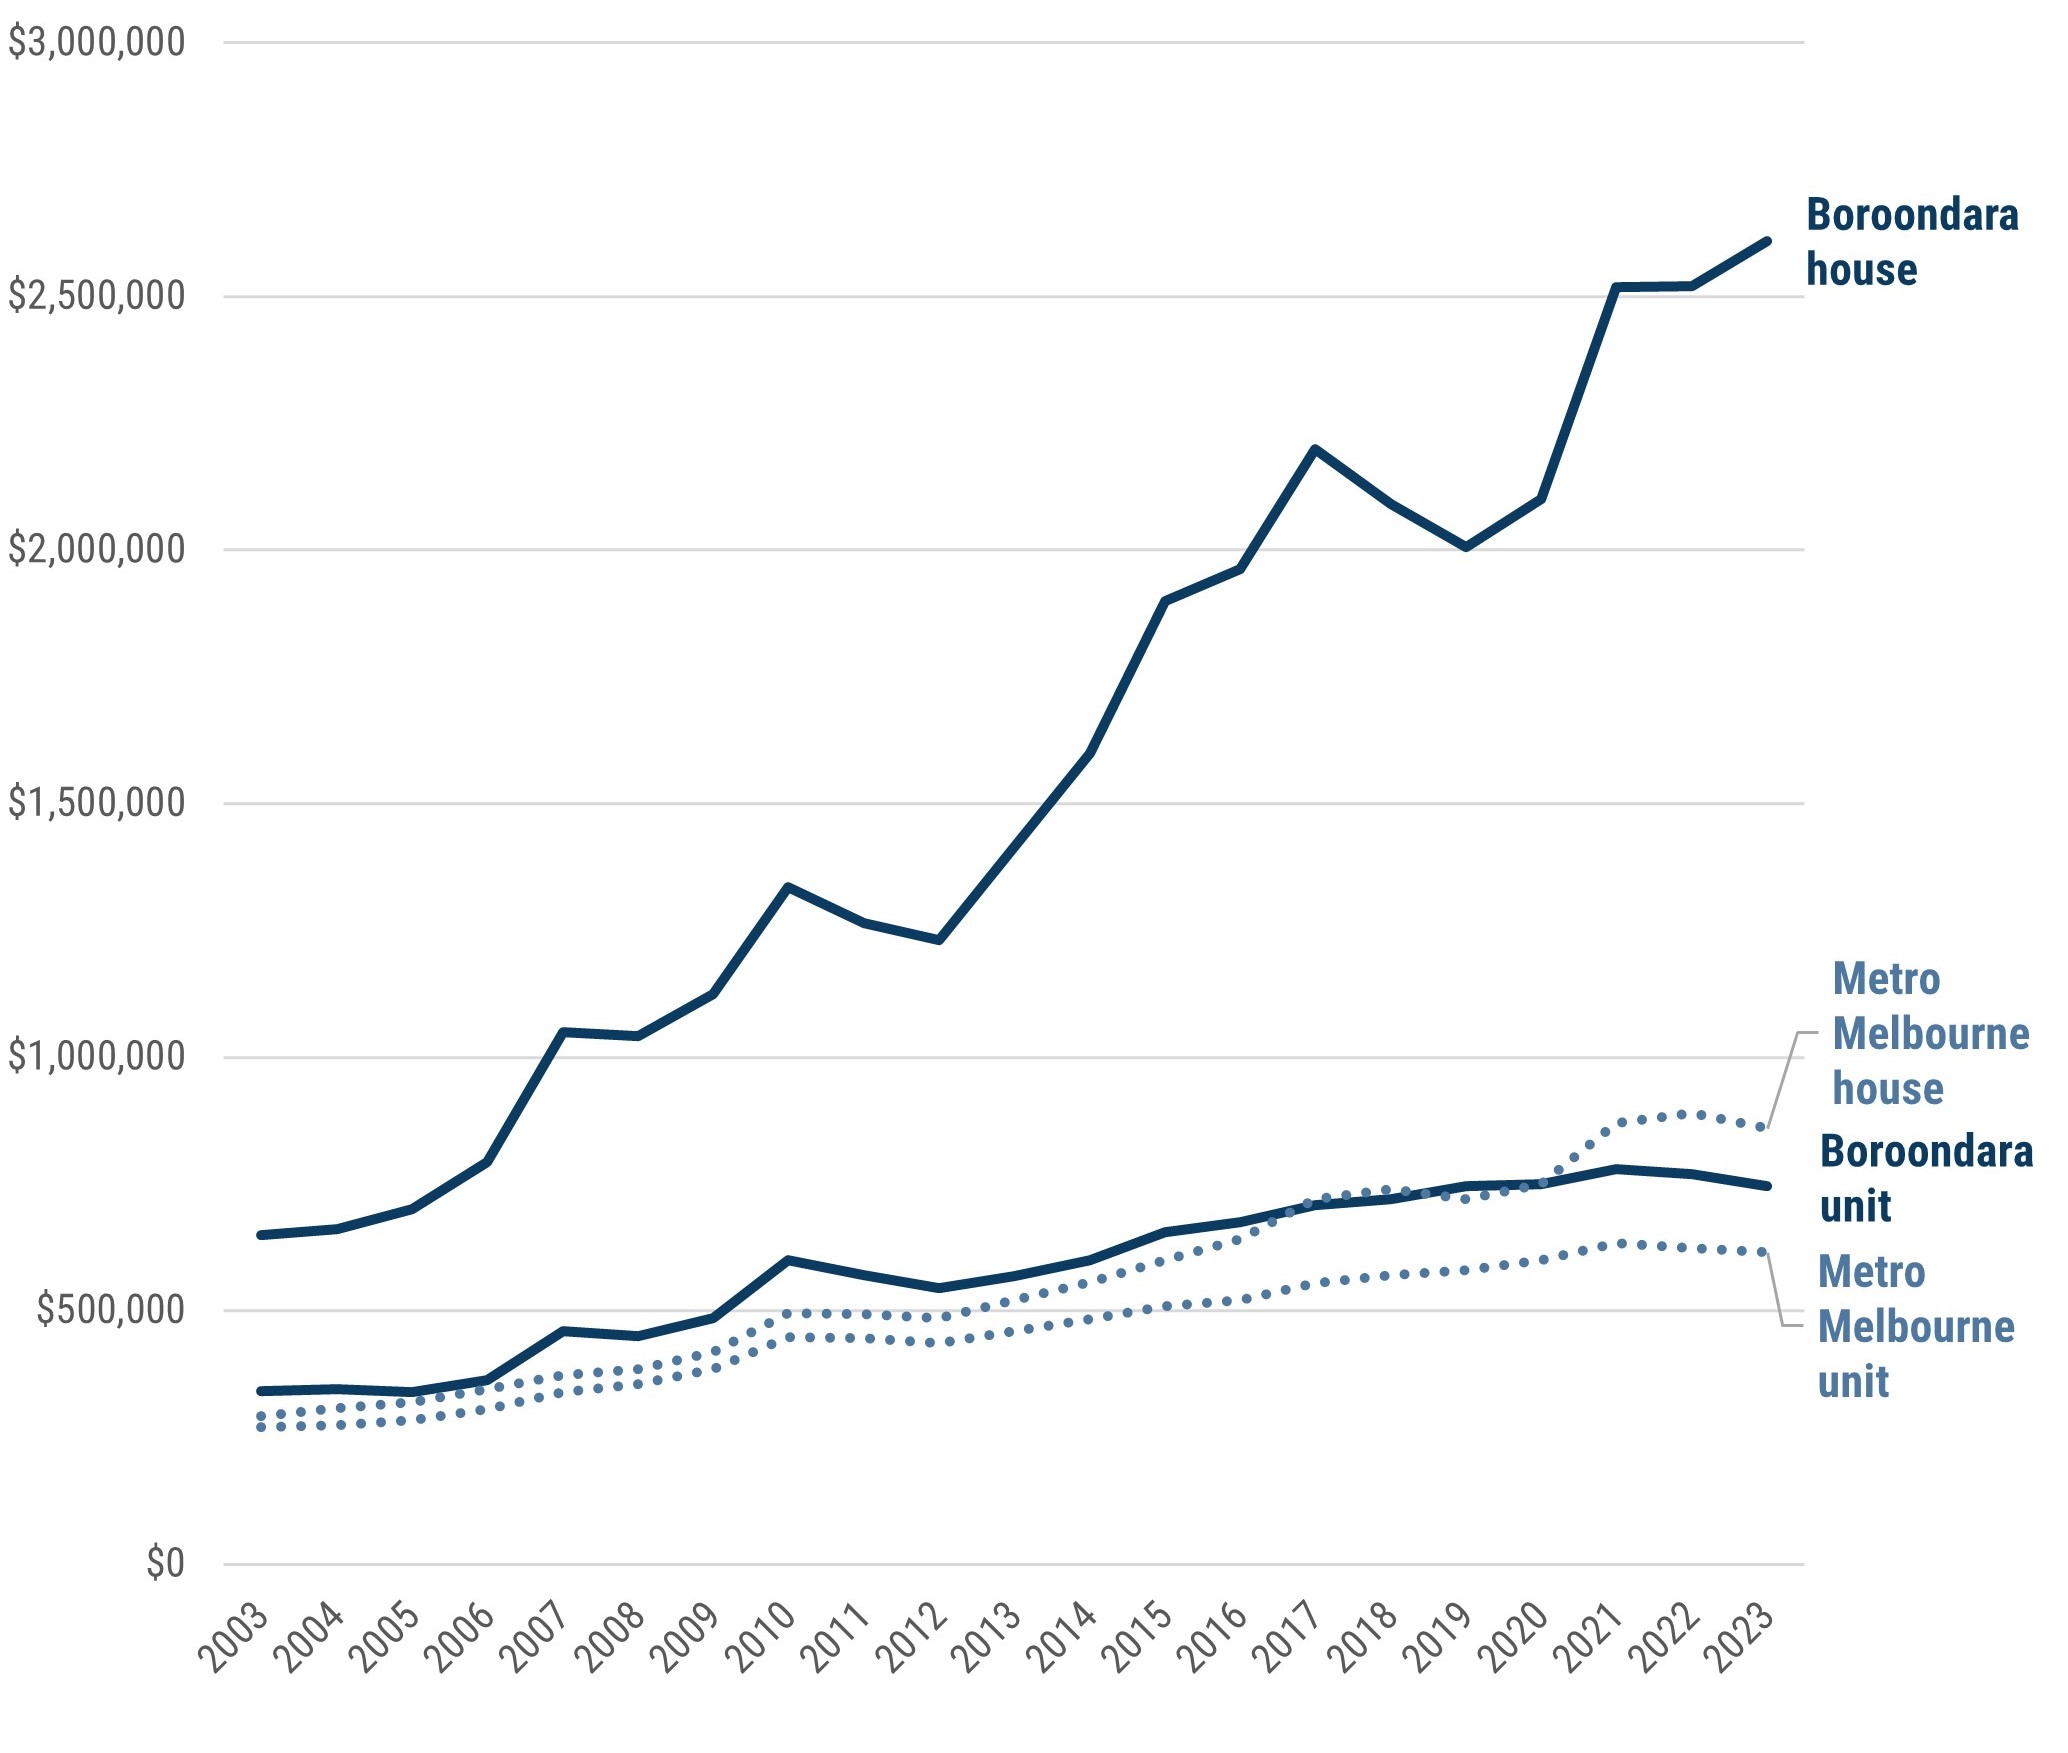
The price of units has also grown but remained more consistent with prices across metropolitan Melbourne (Figure 6).

Figure 6: Median house prices in Boroondara have outpaced median unit prices and median house and unit prices across metropolitan Melbourne. Data source: Property sales statistics from Department of Transport and Planning.
Homelessness
The number of people in Boroondara who were homeless on Census night increased between 2006 and 2016 and dropped again in 2021 (Figure 7).
The 2021 Census was held when states and territories in Australia were under varied COVID-19 pandemic-related restrictions. Results may have been affected by governments’ emergency responses (Australian Housing and Urban Research Institute 2023). For example, the Victorian Government provided accommodation to more than 2,000 Victorians who were sleeping rough, as detailed on the Premier's 'Homes for homeless Victorians during pandemic and beyond' page.
Since 2021, many of these emergency housing strategies have stopped and greater numbers of people may now be experiencing homelessness (Australian Housing and Urban Research Institute 2023).
While the 2021 Census homelessness data is important, it may be less indicative of long-term homelessness trends in Australia due to the effects of COVID-19 (Australian Housing and Urban Research Institute 2023).
For more details, visit the Australian Housing and Urban Research Institute page on 'What the 2021 Census data told us about homelessness'.

Figure 7: People counted as homeless in Boroondara from 2006 to 2021. Data sources: Australian Bureau of Statistics 2021 Census, 2016 Census, 2011 Census and 2006 Census.
The homelessness number of 320 people is equivalent to 1.9 people experiencing homelessness per 1,000 Boroondara residents. This rate is lower than the Greater Melbourne rate of 4.9 people per 1,000.
The table below shows counts for the different types of homelessness in Boroondara. These homelessness counts are likely to underestimate homelessness because having no access to accommodation can present a range of barriers to completing a Census form.
| Type of homelessness in Boroondara in 2021 | Number of people |
|---|---|
| Living in boarding house | 147 |
| Living in supported accommodation | 76 |
| Staying temporarily with other households | 38 |
| Living in severely crowded dwellings | 38 |
| Living in improvised dwelling, tent or sleeping out | 12 |
| Staying in other temporary lodgings | 12 |
| All homeless persons | 320 |
Data source: Australian Bureau of Statistics (ABS) 2021 Census: Estimating homelessness
Note that the rows don't add up to the total estimate because the ABS randomly adjusts smaller numbers to protect privacy.
Of the 320 people who were homeless in Boroondara at the 2021 Census, 65.2% were male and 34.8% were female. Almost half were aged 20 to 39 years (Figure 8).

Figure 8: People counted as homeless in Boroondara in the 2021 Census by age group. Data source: Australian Bureau of Statistics Tablebuilder Pro, 2021 Census
Homelessness in Boroondara is also measured by the number of people seeking support from Specialist Homelessness Services. This included 781 Boroondara residents in 2023-24. For details on this, visit the Australian Institute of Health and Welfare's specialist homelessness services collection data page.
Contact us
For more information on housing statistics in Boroondara, email our Research and Social Planning team or call us on (03) 9278 4444.