The Victorian Government highlights ways that climate change affects health:
- directly by the increased intensity and frequency of extreme weather events such as heatwaves, floods and bushfires
- indirectly through effects on mental health, worsening air quality, risks to food safety and drinking water quality, and changes in the spread of infectious diseases.
In Boroondara, extreme hot weather is probably the most likely of these challenges to wellbeing from climate change. Extreme weather events can cause enormous disruption to people's lives, ranging from direct damage to property and disruption of services provision (for example, power and transport outages), through to the direct and indirect effects on people's physical and mental health.
As our climate warms, we can expect the impacts of extreme heat events to increase unless we build greater resilience into our built and planted environments.
Sun et al (2019) created a Heat Vulnerability Index by combining heat and land cover data with population data on vulnerability factors including:
- population density
- proportion of older adults
- proportion of young children
- proportion of people with disability
- socio-economic resources.
Across Greater Melbourne only Boroondara, Bayside and Stonnington have Heat Vulnerability Index scores of one, the lowest rating.
However, Local Government Area-wide measures can obscure characteristics of smaller areas and there are neighbourhoods within Boroondara with higher Index scores (see Cooling and Greening Melbourne Interactive Map, Department of Transport and Planning 2022).
Aggregate measures like the Heat Vulnerability Index are useful for highlighting some geographical areas where vulnerability might be concentrated, but people at higher risk (for example, older adults, young children, people with existing medical conditions, people who are isolated and people who experience social and financial disadvantage – Coates et al, 2022) live in every Boroondara neighbourhood.
As well as population factors, the Heat Vulnerability Index takes into account heat exposure. Sun et al (2019) report that in 2018 the difference between the average summer land surface temperature in Boroondara versus a non-urban native vegetated baseline was +7.50 degrees Celsius. This is lower than the mean for metropolitan Melbourne (+8.36 degrees Celsius).
Across Melbourne, the Urban Heat Island (UHI) effect is lower where vegetation cover is higher. Based on measures taken of a 53.6km2 region of Melbourne’s Inner East (including a small area of Boroondara’s north east), it was found that grasses, shrubs and small trees all contribute to cooling, but medium and large trees have the greatest impact on reducing UHI intensity in this region (Rakoto et al, 2021). This makes Boroondara’s tree canopy an important protective factor, as demonstrated by Figure 1.
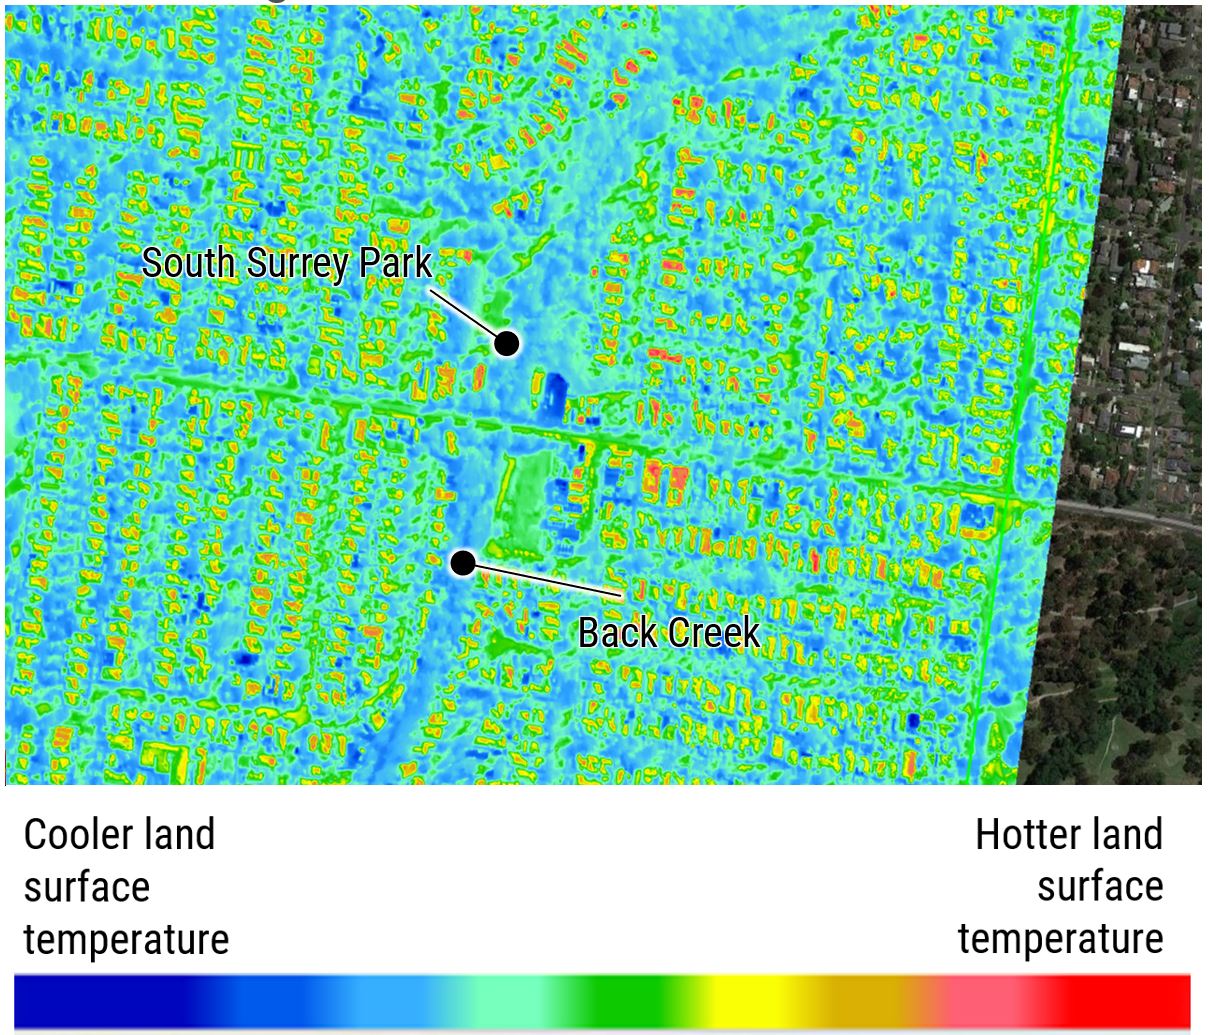
Figure 1: Land surface temperature readings taken in March 2022 show trees in South Surrey Park and north and south along Back Creek as cooler than much of the surrounds. Source: map prepared for Council by ArborCarbon.
Map 1 shows the distribution of tree canopy across Boroondara, aggregated to one-hectare hexagons. The underlying data was collected via high resolution aerial imagery during March 2022. Areas of high canopy cover are shown in purple in the north along the Yarra River corridor and throughout Canterbury and Surrey Hills. Areas of low canopy cover are shown in yellow. These are generally close to major roads and intersections and activity centres (for example, along Burwood Road, Camberwell Junction and Glenferrie Road) and mixed use areas such as the industrial/educational zone around Tooronga, Auburn and Toorak roads.
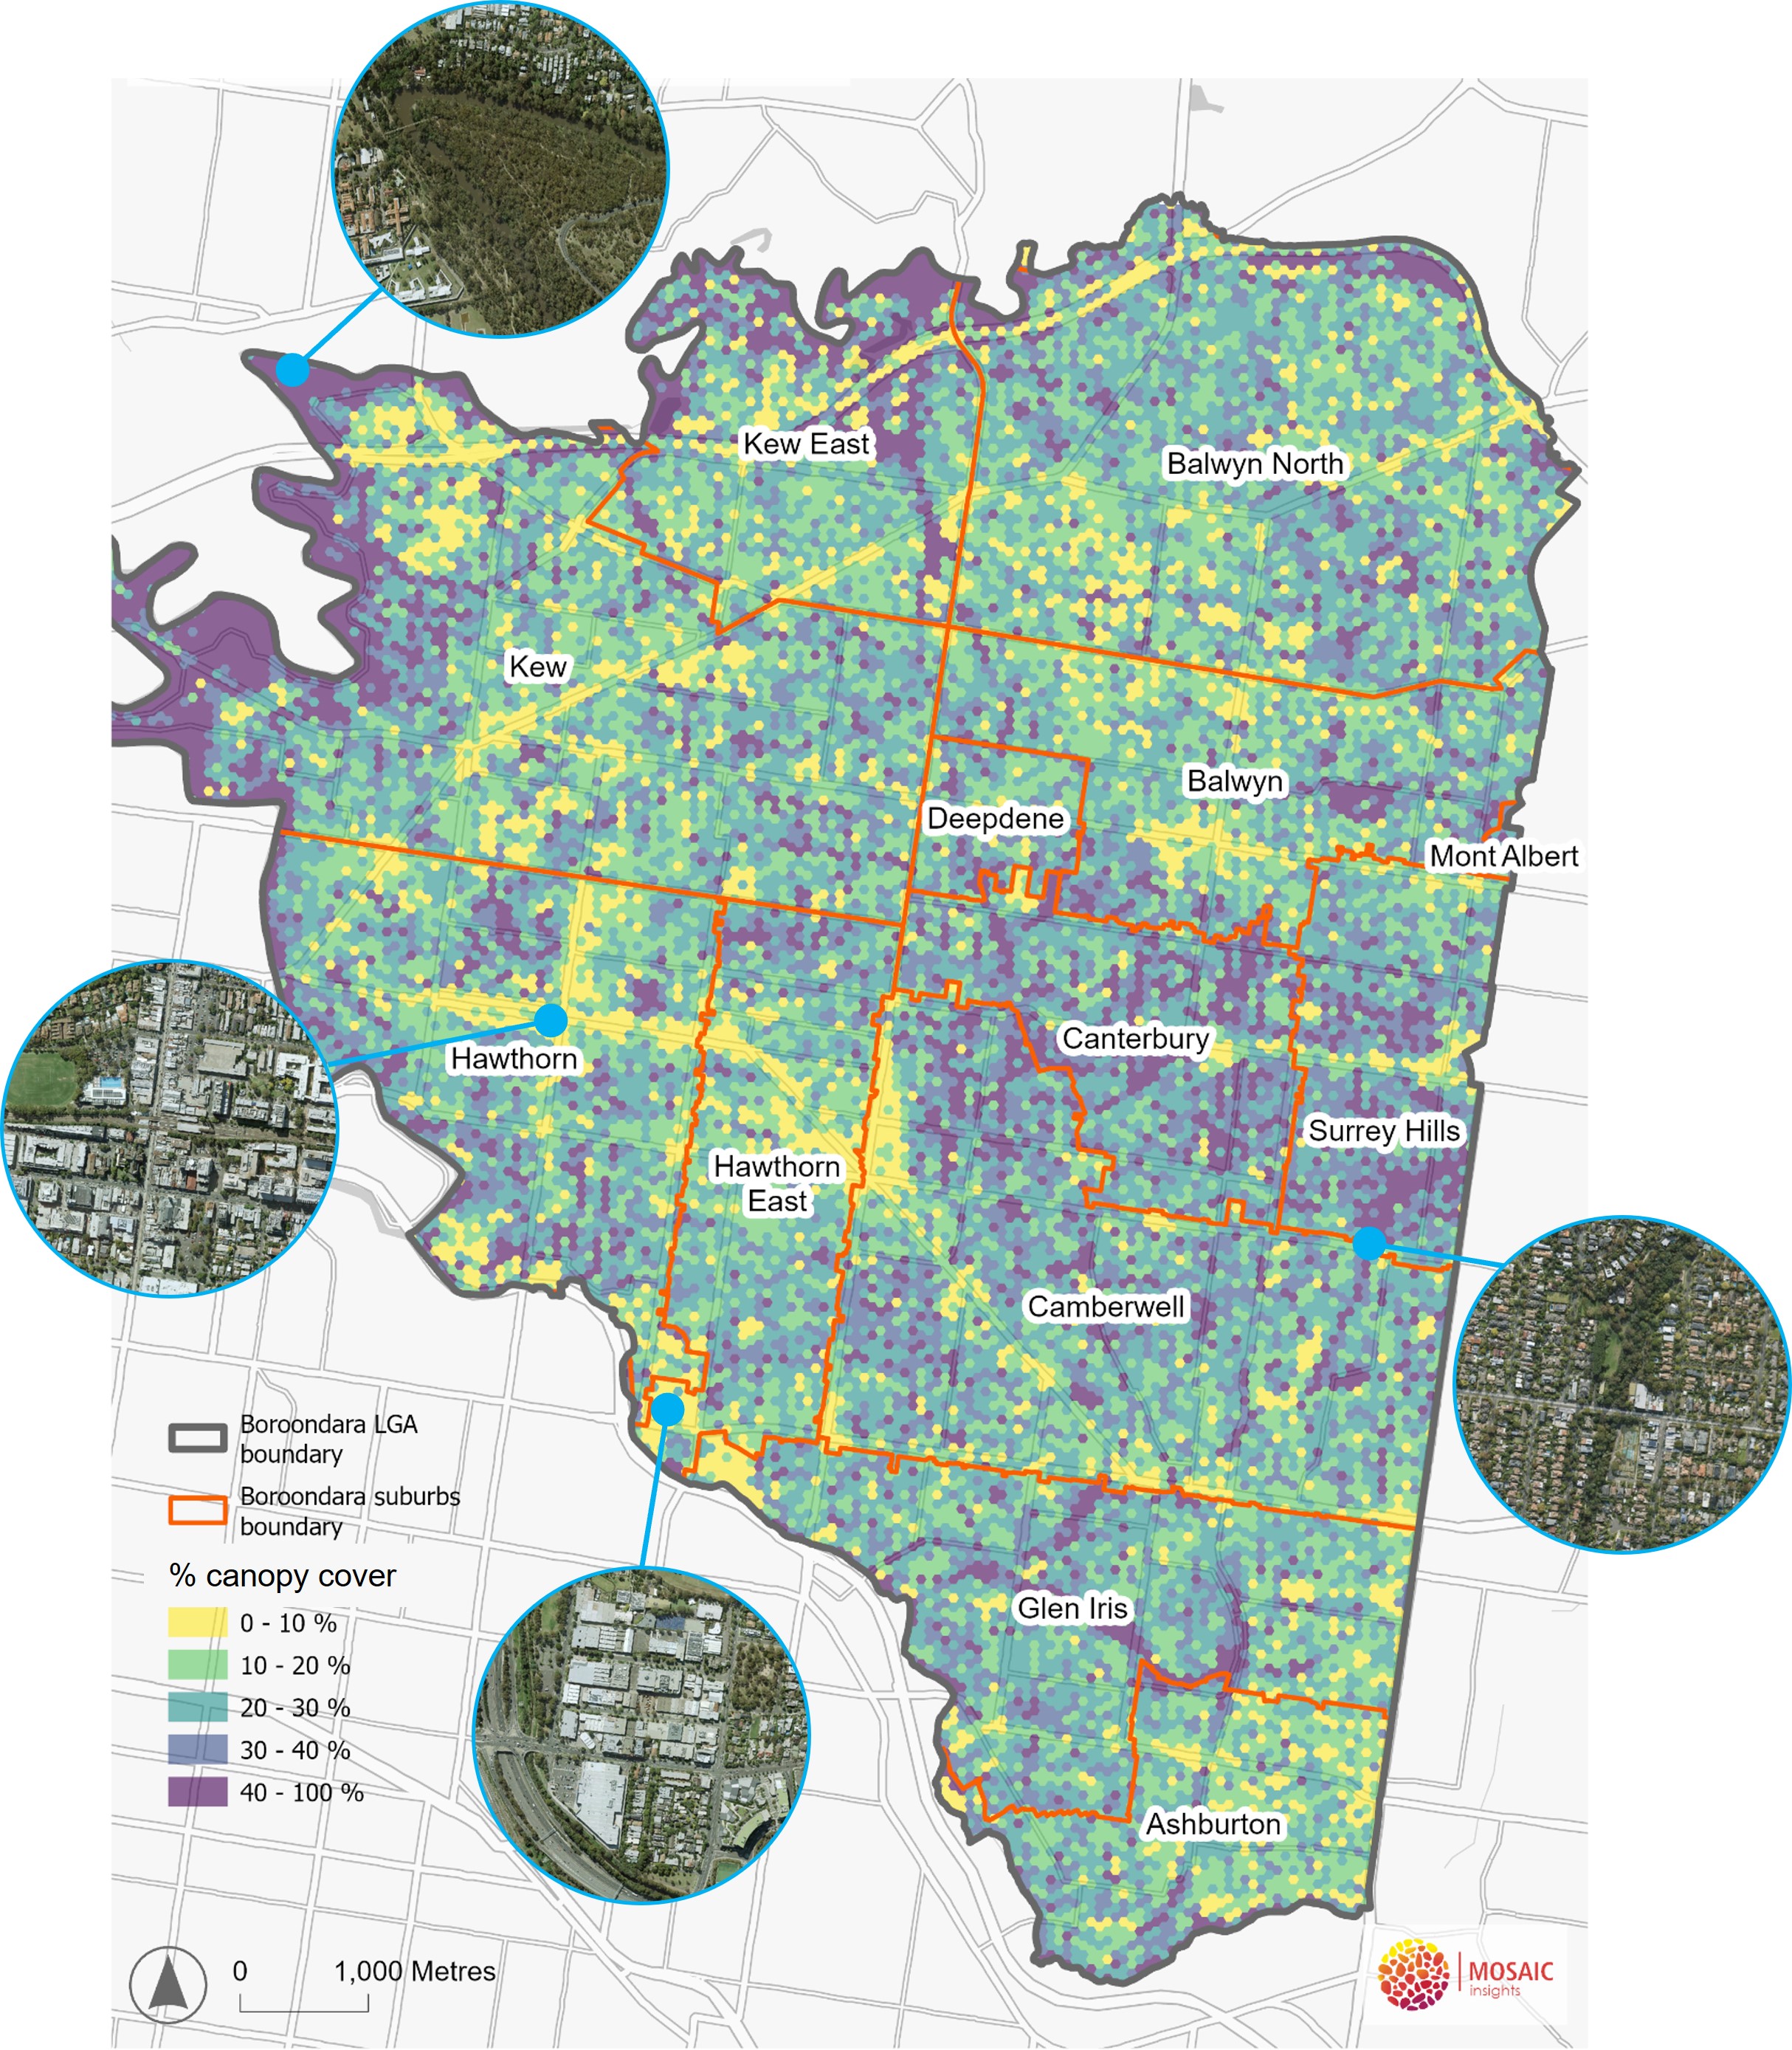
Map 1: The distribution of tree canopy across Boroondara at March 2022, with aerial imagery of selected areas of high and low canopy cover. Source: tree canopy map prepared for Council by Mosaic Insights 2023, based on canopy cover data gathered on behalf of Council by ArborCarbon. Aerial imagery from MetroMap, March 2022.
More information
- Find out how we are responding to the challenge of climate change on our Climate Action Plan page.
- Learn about our new strategy to increase tree canopy in Boroondara on our Engage Boroondara site.