Major achievement
Strategic objective
Ensure decisions are financially and socially responsible through transparent and ethical processes.
Major initiative 7.7
Work with Aboriginal and Torres Strait Islander peoples and the community to promote and support reconciliation in Boroondara by implementing Year 1 actions of the Boroondara Reconciliation Strategy 2022-26.
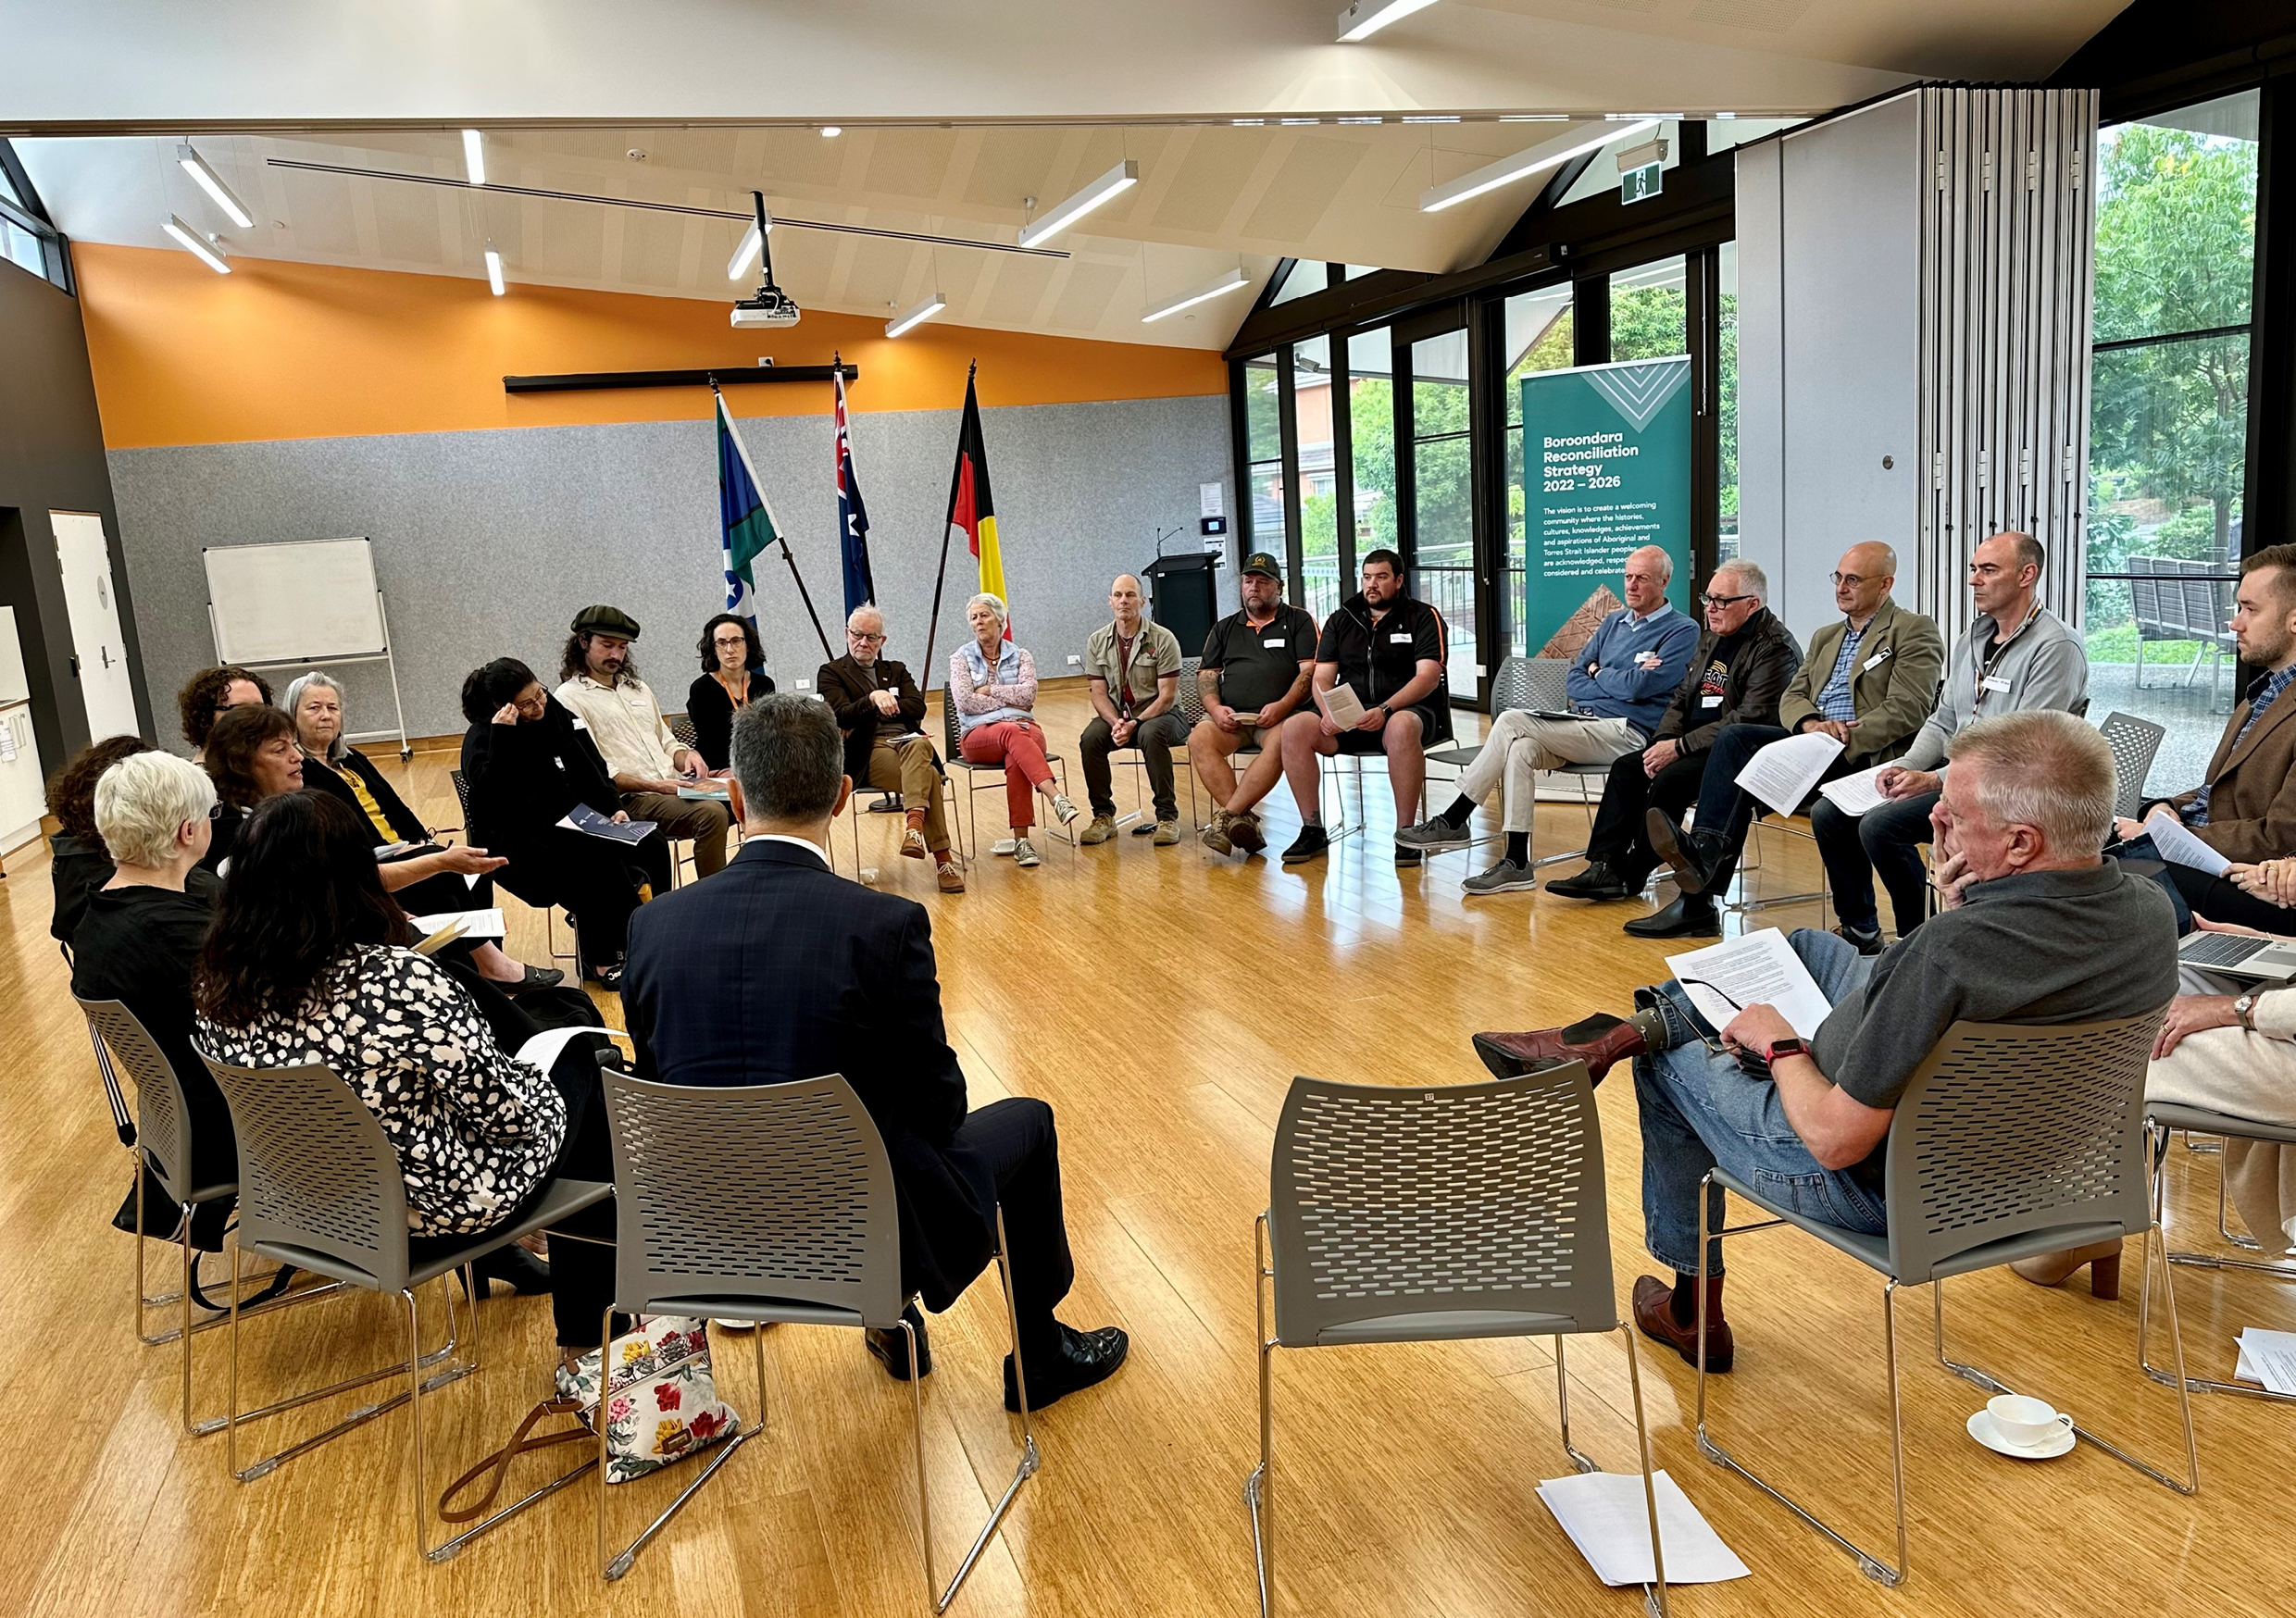
Boroondara Reconciliation Strategy
Part of the vision of the Boroondara Reconciliation Strategy is to strengthen relationships with Aboriginal and Torres Strait Islander organisations and peoples, so we can work in partnership together, and with our broader community, to progress reconciliation locally.
During year 1 of the strategy, we aimed to strengthen existing relationships and hear from diverse voices from the Aboriginal and Torres Strait Islander sector on a range of local projects. We have a strong foundation to build on and continue to develop respectful, flexible, genuine relationships built on cultural understanding and reciprocity with Aboriginal and Torres Strait Islander peoples and organisations.
This year, councillors and Council officers who make up our internal Boroondara Reconciliation Advisory Committee heard from a range of presenters, including Elders from Wurundjeri Woi-wurrung Cultural Heritage Aboriginal Corporation and local Aboriginal and Torres Strait Islander peoples and organisations.
Our officers also met regularly with Wurundjeri Woi-wurrung Elders to consult on a range of projects including the development of the Gardiners Creek (Kooyongkoot) Master Plan and the City of Boroondara Sport and Recreation Inclusion Guide, which will be available on our website later this year. These cultural consultations were also an opportunity to keep the Elders informed about the progress of our Reconciliation Strategy actions.
We also hosted a special information session to thank a diverse range of stakeholders from the local Aboriginal and Torres Strait Islander sector and express our gratitude for their time, contribution, and expertise during the first year of the strategy.
Theme 7 performance
This is a breakdown of the strategic indicators, progress of initiatives and other service performance indicators for this theme. You can find out more detail about these indicators and previous year’s results in the full report.
You can also read through our continuous improvement initiatives, community engagement, and benchmarking activities for this theme in the full report.
Strategic indicators
Many of our our strategic indicators saw consistent or improved results in FY2022-23. The strategic indicators that met or exceeded the forecast include the following.
Percentage of Freedom of Information requests responded to within prescribed timeframes
Forecast: 100%
2022-23 result: 100%
Satisfaction with informing the community
Forecast: 65 to 67 (out of 100)
2022-23 result: 65 (out of 100)
Current assets compared to current liabilities
Forecast: 201.97%
2022-23 result: 224.08%
Number of transactions initiated via our website
Forecast: 68,330 to 70,000
2022-23 result: 100,084
Number of cybersecurity incidents that compromise user data
Forecast: 0
2022-23 result: 0
Access to Council’s website (percentage of time available)
Forecast: 99.8% to 100%
2022-23 result: 99.99%
Some indicators did not meet our forecast this year:
Satisfaction with community consultation and engagement
Forecast: 62 to 64 (out of 100)
2022-23 result: 59 (out of 100)
This result is consistent with previous years and performance across state and metro groups. Through recent research, we gained deeper insights into what underpins the community’s perception of our performance in this area. This identified several opportunities to promote community awareness, use clearer language, increase our focus on consultations for hyper-local issues, and improve how we communicate with the community after consultations.
Satisfaction with the overall performance of Council
Forecast: 71 to 72 (out of 100)
2022-23 result: 67 (out of 100)
We continue to be one of the highest performing councils in this area. While this is a decline of 4 points from FY2021-22, this mirrors declines across the sector. Within a challenging landscape of lower consumer sentiment and financial pressures experienced by households, we continue to perform in line with or higher than the metro (62) and state (56) average.
Satisfaction with customer service
Forecast: 77 to 79 (out of 100)
2022-23 result: 73 (out of 100)
Providing excellent customer service that meets community expectations continues to be a focus area for us. Initiatives are in place across all service areas to ensure our aspiration of always putting the customer at the centre of what we do is achieved to the satisfaction of our residents.
Satisfaction with making community decisions
Forecast: 61 to 63 (out of 100)
2022-23 result: 59 (out of 100)
This has remained at the same level as the previous 9 years. We will continue to place the community interests at the centre of our decision-making.
Average time callers wait before their call is answered
Forecast: 45 to 60 seconds
2022-23 result: 70 seconds
In April to June 2023 our customers waited 39 seconds on average for the call to be answered, which is well below our KPI of less than 60 seconds. The higher average wait time for the full year was caused by resourcing challenges in July to September 2022, and unexpected call volumes in October to December 2023 from the change in vendor for recycling collections.
Number of calls abandoned when customers are trying to reach Council's customer service
Forecast: 3% to 3.5%
2022-23 result: 5.5%
We met our target of 3.5% in January to June 2023. The full year’s result did not meet the forecast due to impacts relating to resource capacity caused by illness, challenges with a new waste service provider, and an increase in calls due to severe weather in July to December 2022.
Percentage of adopted capital projects completed at the conclusion of the financial year (based on most recent amended budget).
Forecast: 90% to 95%
2022-23 result: 78%
Issues inhibited project delivery including a WorkSafe investigation, delayed community consultations, additional consultation due to scope changes, weather, building permit delays, other authority delays, the global supplies shortage, long lead time, availability of contractors, and low tender submissions.
Progress of initiatives in the Budget
Initiatives that were completed in FY2022-23:
- Ensure we operate within a financially sustainable framework through preparation of the Annual Budget 2023-24 (plus 3 subsequent financial years) in-line with statutory requirements and submit for consideration by our councillors
- Services are designed to deliver enhanced customer and business value through the review of a minimum of 3 ‘customer facing’ services using a service design approach.
- Performance reporting is engaging and fit-for-purpose for the community and decision-makers through implementing enhancements to our reporting mechanisms and communication methods.
- Enable effective management of customer requests by completing the detailed design and commencing the build of our new customer and relationship management system.
- Enhance management of property and rating activities, including management of customer enquiries for rates, permits, infringements and land information by completing the detailed design and commencing the build of our new property and rating system.
- Work with Aboriginal and Torres Strait Islander peoples and the community to promote and support reconciliation in Boroondara by implementing year 1 actions of the Boroondara Reconciliation Strategy 2022-26.
- Educate our community on our decision-making processes by refreshing the video content available on our website.
- Protect customer privacy and data through securely managing, monitoring and enhancing current software to minimise service disruptions and the risk of data security breaches.
The one initiative for this theme that commenced in FY2022-23 and is 20% complete was improving customer experience and satisfaction by implementing the Customer Charter and communicating our service principles to the community. The Customer Charter has been reviewed and areas for improvement have been identified, including revisions to contemporise the message to meet current community expectations and address customer and team member understanding of the service commitments. The Customer Charter (now Customer Promise) has been reworded and introduced as an improvement initiative in the August Boroondara Bulletin, with further communication scheduled for September to October 2023.
Other service performance indicators
The following other service performance indicators and measures are based on the FY2022-23, unless stated otherwise. For more detail, including supporting commentary and how these results were calculated, see the full annual report PDF.
Governance
Cost of elected representation
FY2022-23: $54,403
FY2021-22: $53,352
Satisfaction with Council decisions
FY2022-23: 59 (out of 100)
FY2021-22: 61 (out of 100)
Councillor attendance at council meetings
FY2022-23: 98%
FY2021-22: 98%
Satisfaction with community consultation and engagement
FY2022-23: 59 (out of 100)
FY2021-22: 59 (out of 100)
Council decisions made at meetings closed to the public
FY2022-23: 5%
FY2021-22: 4%